905-477-3600
 MapCast Help
Help Topics
- MapCast
- Orthophoto
- Elevation
- 1. What’s MapCast?Author: Salina Morrow
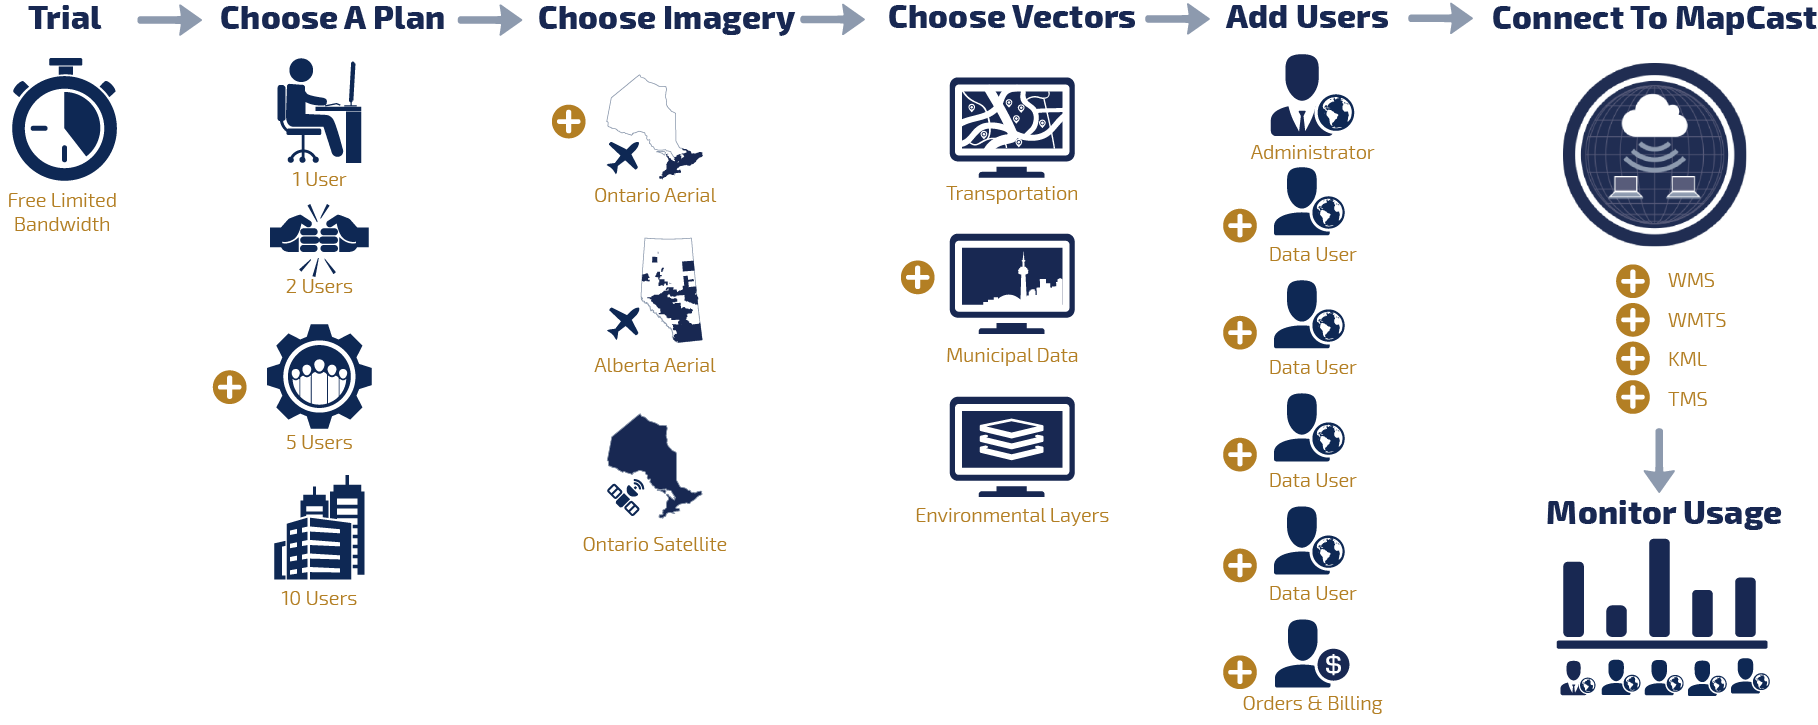
MapCast is a live, on-demand connection to First Base Solutions' complete library of high-resolution orthophotography and elevation contours served directly into your CAD or GIS workstation. It’s a Web Mapping Service (WMS); a standard protocol used for serving georeferenced map images over the Internet. Once you connect MapCast into your WMS compliant software, the aerial imagery base layer will load into your mapping project in a similar way as data layers you store locally. Having an external data source available through a WMS like MapCast reduces internal network loads and the costs associated with data storage and management. It is an efficient and cost effective way for organizations to access large data sets, reduce network overhead, and avoid data purchase, management and update costs. First Base Solutions handles it for you.
- 2. Is there a tutorial to see MapCast in action?Author: Salina Morrow
Yup. You'll laugh, you'll cry, you'll learn!
If you want to quickly learn how to use a WMS (web mapping service) to stream aerial imagery and geographic data into your desktop GIS or CAD software, or just want to improve your skills and learn a few tricks of the trade, this video will get you up to speed quickly with real world examples.
In this this video you will learn how to Connect to MapCast, Display aerial imagery and elevation contours, Analyze your own mapping data in context, and Explore year over year changes in land use patterns. Follow the transcript here.
- 3. What kind of data layers are available and how are they organized?Author: Salina Morrow
MapCast connects you to all of First Base Solutions’ high resolution aerial imagery, plus 1-m elevation contour lines. Layers are grouped by province, upper tier municipality, region and vintage. For each region and vintage, high, medium and low resolution layers are available, each resolution will only be active between preset scale ranges to ensure maximum display speed.
- 4. Can I connect to MapCast through a proxy?Author: Salina Morrow
Proxy servers will affect how you connect to the service, consult your IT staff if working behind a proxy.
- 5. I'm having trouble connecting to MapCastAuthor: Salina Morrow
Our users have recommended this article.
- 6. How do I check my bandwidth usage on MapCast?Author: Salina Morrow
Login to the MapCast dashboard: http://fbswms.firstbasesolutions.com/index.php From this website, you can access your unique URL for connecting to the MapCast orthophoto library, monitor usage, generate reports, add users and access help documents.
- 7. What coordinate reference systems does MapCast support?Author: Salina Morrow
The WMS supports requests for the following coordinate reference systems:
EPSG Code Description
EPSG:2018 NAD27(76) / MTM zone 9
EPSG:2019 NAD27(76) / MTM zone 10
EPSG:2020 NAD27(76) / MTM zone 11
EPSG:2021 NAD27(76) / MTM zone 12
EPSG:26909 NAD83 / UTM zone 9N
EPSG:26910 NAD83 / UTM zone 10N
EPSG:26911 NAD83 / UTM zone 11N
EPSG:26912 NAD83 / UTM zone 12N
EPSG:26913 NAD83 / UTM zone 13N
EPSG:26917 NAD83 / UTM zone 17N
EPSG:26918 NAD83 / UTM zone 18N
EPSG:26919 NAD83 / UTM zone 19N
EPSG:26920 NAD83 / UTM zone 20N
EPSG:26921 NAD83 / UTM zone 21N
EPSG:26922 NAD83 / UTM zone 22N
EPSG:3161 NAD83 / Ontario MNR Lambert
EPSG:32189 NAD83 / MTM zone 9
EPSG:32190 NAD83 / MTM zone 10
EPSG:32191 NAD83 / MTM zone
EPSG:3775 NAD83 / Alberta 3TM ref merid 111 W
EPSG:3776 NAD83 / Alberta 3TM ref merid 114 W
EPSG:3777 NAD83 / Alberta 3TM ref merid 117 W
EPSG:3778 NAD83 / Alberta 3TM ref merid 120 W
EPSG:4326 WGS 84 Geographic
EPSG:900913 World Mercator - 8. Is bandwidth usage for contours the same as for imagery?Author: Salina Morrow
Yes, all data transferred through the MapCast WMS subscription is tracked the same way. However, the size of the file will vary depending on the data contained, so in general, the contours would contain less data (colours) than an orthophoto image and therefore use less bandwidth.
- 9. How can I make the most of my bandwidth?Author: Salina Morrow
There are several options:
- Turn off the MapCast layer off when panning and zooming.
- Turn the MapCast layer off when zoomed out to smaller scales beyond 1:10,000.
- In CAD, choose the resample raster option to crop the imagery to your view so excess imagery will not draw when you zoom out.
- In ArcMAP, choose the cache option to avoid reloading the image when turning the MapCast layer off and on.
- Make sure that only the relevant imagery set for the study area is active and turn all others off.
- Select “jpeg” for the image format to reduce the size of the image requested.
- Decrease the size of the image being requested by making your application window smaller.
- Wait for the MapCast layer to draw completely before requesting a new image.
- 10. Can I print or manipulate the image layer in MapCast?Author: Salina Morrow
Maximum printing sizes vary depending on the dpi of the print. A 300dpi print has a maximum size of 6.8 inches, a 200dpi print has a maximum size of 10.2 inches and a 150dpi print has a maximum size of 13.6 inches. The image layers in MapCast are not editable for end users to manipulate, but your local display can be usually adjusted for brightness and contrast. Consult your specific software provider for instructions on how to do this.
- 11. How is bandwidth measured?Author: Salina Morrow
Users on MapCast with WMS compliant software can request an image that will match the screen resolution or scale of the software’s window. The request is sent through the Internet to the FBS servers where the image is generated and then returned to the user to be displayed in the software’s window. This action will count as one image, each time the user refreshes, pans or zooms in or out on the software’s window, an image will be generated and counted against the bandwidth monthly limit. The maximum image size returned by the service is 2048 x 2048 pixels.
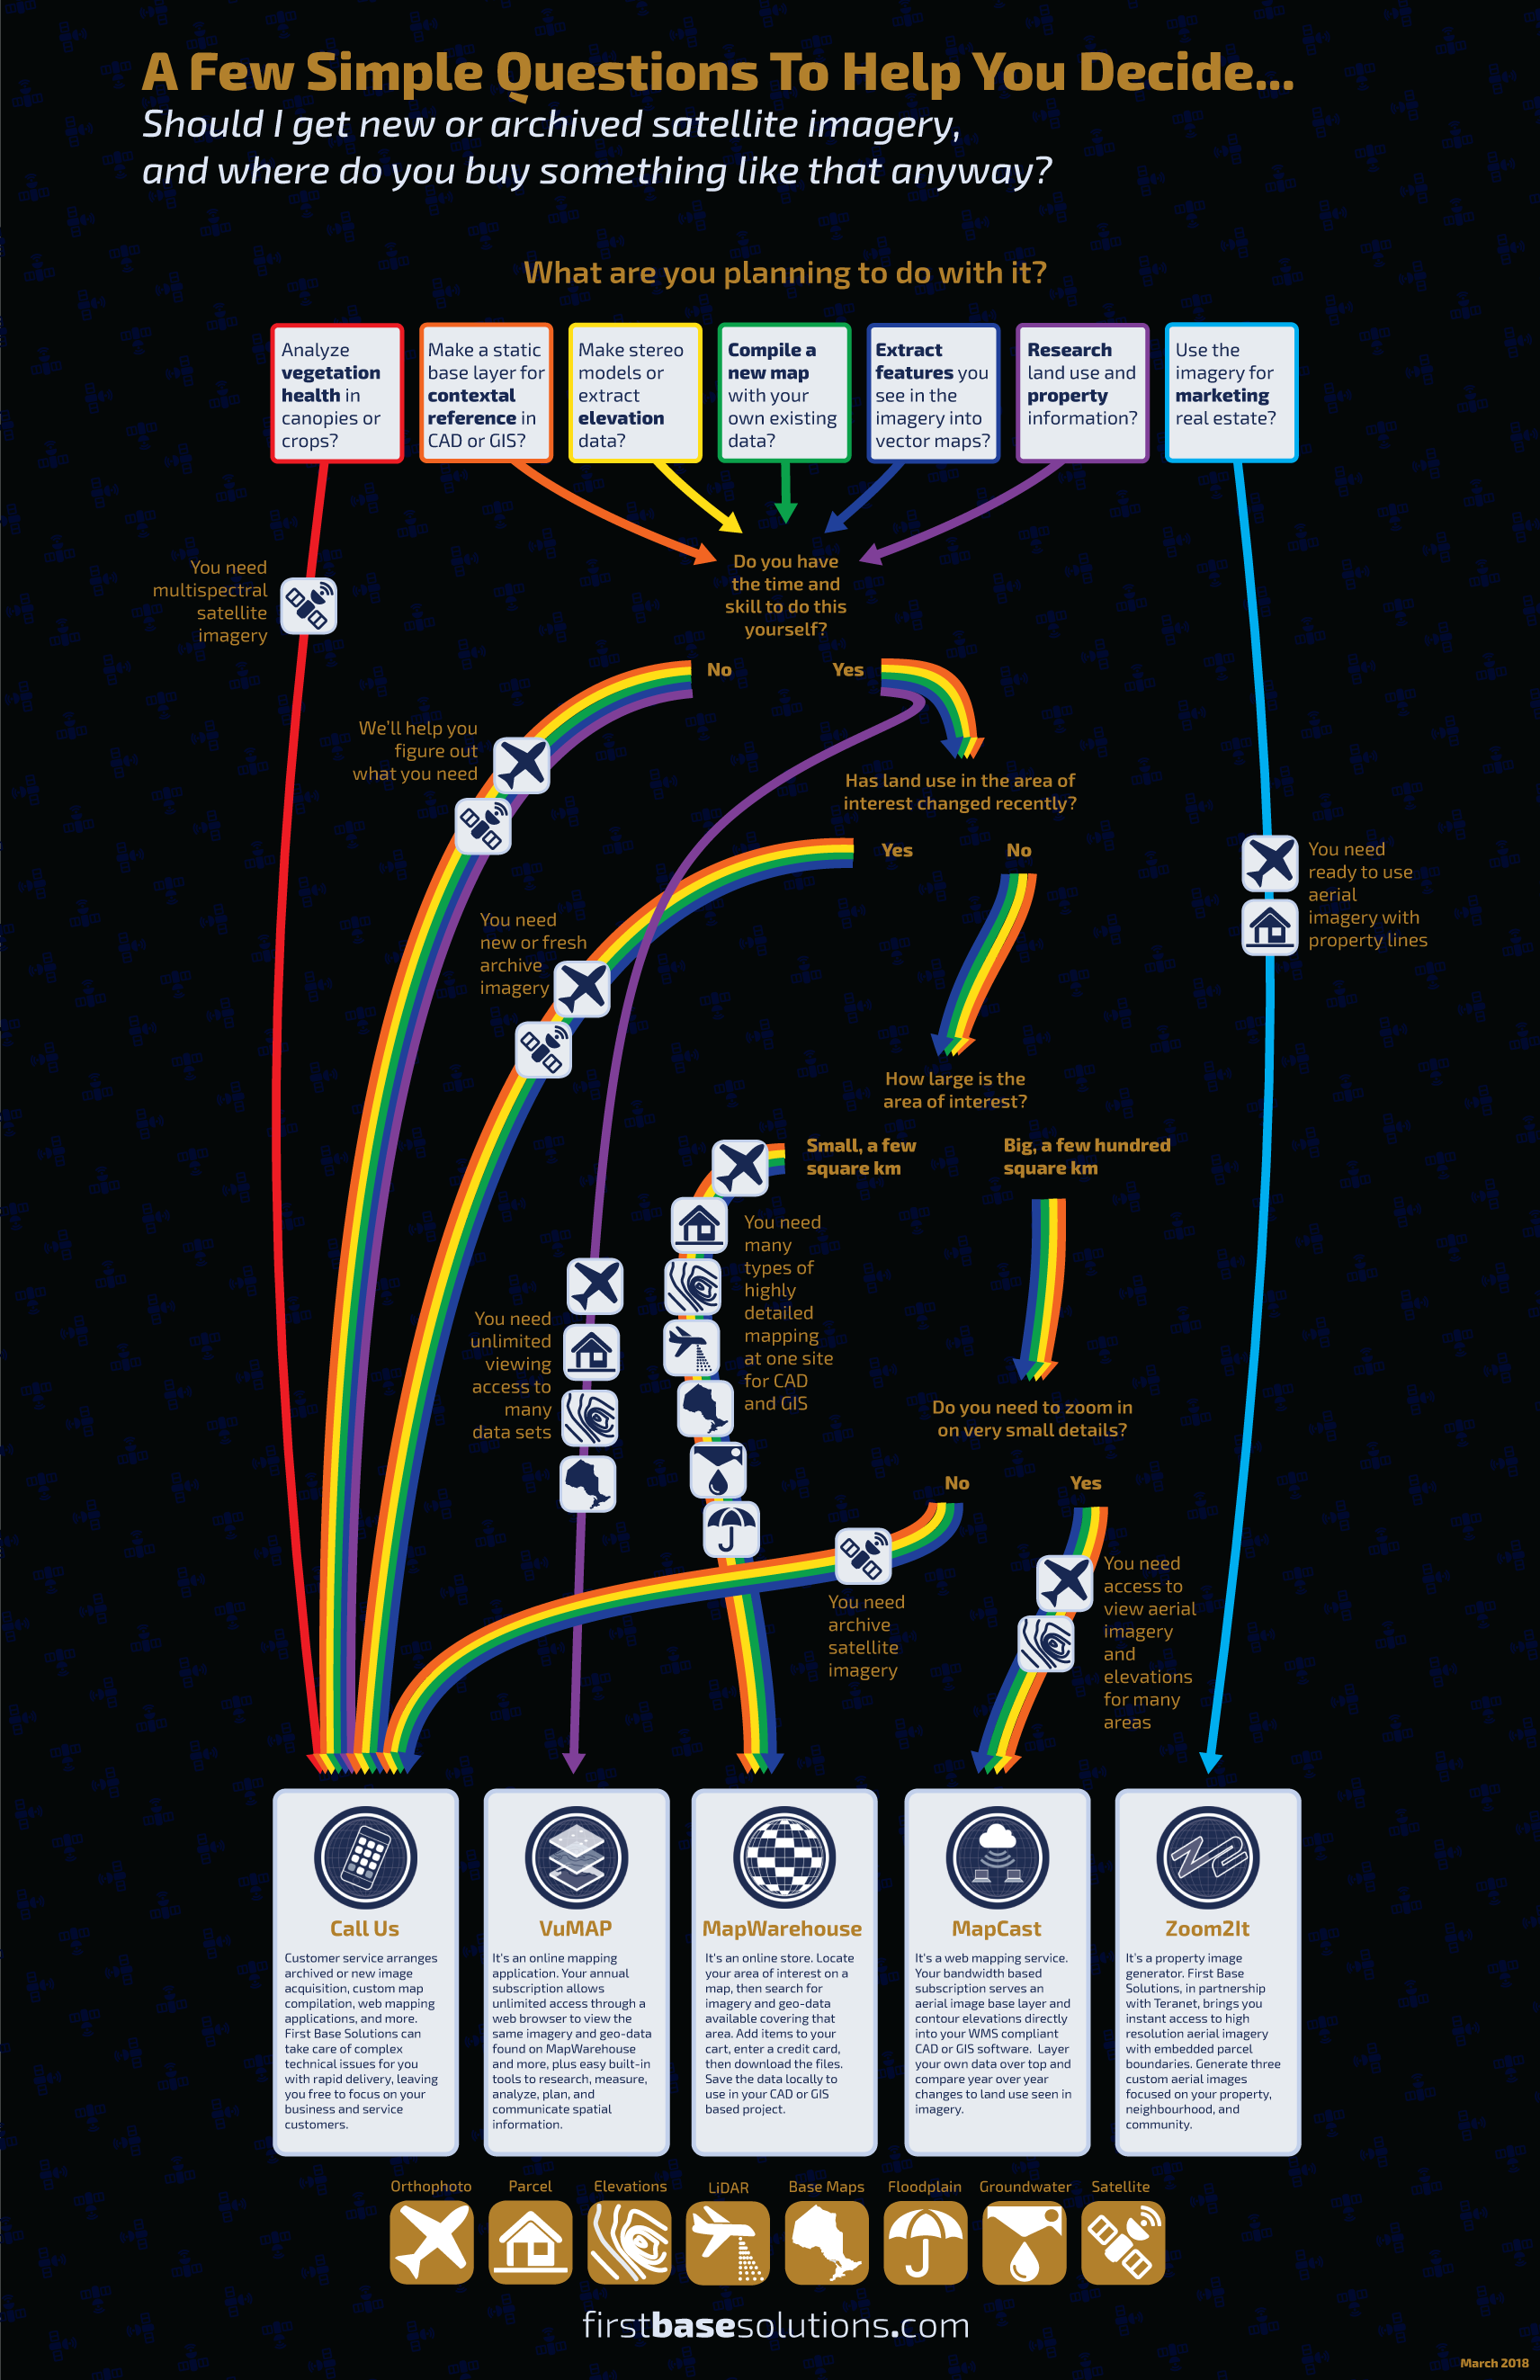
- 12. There's no imagery on MapCast for my area, is there anything else available?Author: Salina Morrow
Yes. First Base Solutions can acquire new photo as a custom request. First Base Solutions is also a licensed reseller of DigitalGlobe satellite imagery. Satellite imagery is an ideal option for remote or inaccessible areas, and offers excellent value for large coverage areas with a moderate reduction in image resolution compared to imagery captured by aircraft. Contact us for a quote.
- 13. I need to do basic research with the orthophoto over a huge area which is going to run over budget and use my whole hard drive. Is there a way to just view the data without downloading it?
- 14. I have a friend in real estate who would find this really useful. Is there a more basic version of the imagery available?Author: Salina Morrow
Yes! We also provide a service called Zoom2It which can be accessed through a real estate agent's GeoWarehouse account. Simply chose a property from the map or by the street address, and you can download a set of three aerial photos of the property at a property, neighbourhood, and community zoom level, with the Teranet property boundary overlaid. Agents may use these images for marketing the chosen property.
- 15. I can't find the elevation data for my area in MapWarehouse. How can I get this information?Author: Salina Morrow
It's usually possible to produce a highly detailed custom elevation model using current orthophoto or satellite imagery, where this imagery exists. Contact us for a quote. We also have 1983 OBM (Ontario Base Mapping) for the entire province which has 5m interval contours in southern Ontario and 10m interval contours in northern Ontario.
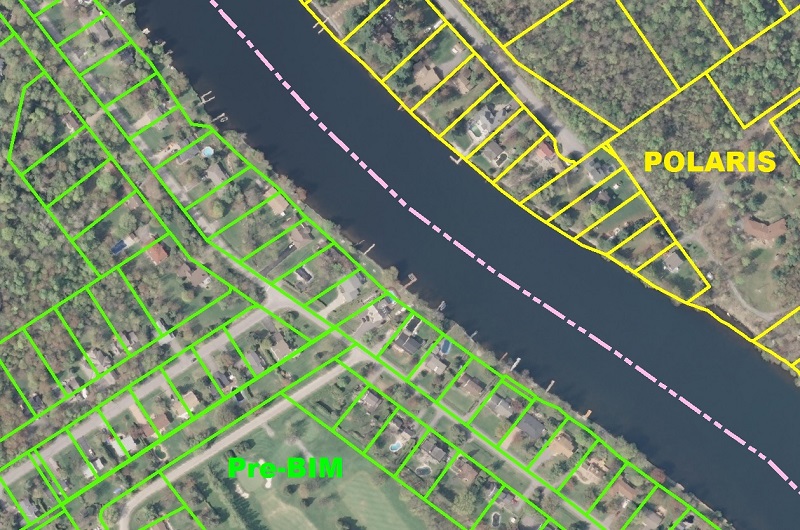
- 16. Why doesn't the property boundary line up perfectly with the orthophoto?Author: Salina Morrow
The orthophoto are generally spatially accurate to double the resolution value. Simply put, if a photo has resolution of 20cm, any point on the photo will be accurate within 40 cm of its true location. For the parcel data, different Land Registry Offices in Ontario were originally drawn to different standards and then later integrated into one dataset that's now maintained by Teranet. The most accurate being POLARIS (Province of Ontario Land Registration Information System) which is based on surveys, followed by BIM (Basic Index Mapping) which is based on 1:10,000 scale mapping or smaller, and Pre-BIM, which is compiled in areas where good control data is less available, making it the least positionally accurate. In an area where pre-BIM standards are used, it's not unusual for the property lines to be off by 10 m or more from where you would expect them to lie on the photo. Where your orthophoto and property lines don't align perfectly, it's likely due to different accuracy standards used to create one or both of the datasets.
- 17. How much does it cost?Author: Salina Morrow
Most downloadable data is priced based on 500m x 500m tiles. For most orthophoto, the cost is $70 per 500m tile, and $150 per 1km tile, with progressive discounts applied automatically for orders greater than 5 tiles. Vintage imagery may be priced lower in certain areas. Contours are $60 per tile. DEM are $60 per tile in Golden Horseshoe and $30 per tile for the Simcoe-Kawartha dataset.
LiDAR costs $100 per tile.Teranet parcels are $77 per tile at a flat rate, regardless of the number of parcels contained in the 500m square area. Property mapping can also be purchased as a custom order at $13 per parcel plus labour, with progressive discounts for orders over 10 parcels.
For Ontario Base Mapping, each map sheet is priced based on file format. View-only PDF or print copies are $15. Georeferenced raster copies (GeoTiff format) are $30. GIS and CAD formats are $100 per map sheet.
For Floodplain mapping, PDF maps are $30, CAD formats are $125 each.
Subscription based services such as VuMAP are priced based on the number of users, starting $1500 per year. MapCast subscriptions are priced based on bandwidth, starting at $500 per year for 500MB of bandwidth per month.
We are always open to providing custom services and solutions. Contact us directly to request a quote.
- 18. What's the difference between raster and vector?Author: Salina Morrow
"Raster" refers to data made of pixels, like our orthophoto. Common raster file types you'll find on our website include JPG, MrSID, GeoTIFF and ECW. "Vector" refers to data made of points, lines, polygons, and often includes text elements as well. Common vector file types you'll find on our website include SHP, DWG, and DGN. Learn More
- 19. How do I reference maps from FBS as cited works?Author: Salina Morrow
It depends on the map and it's source. A full explanation can be found here.
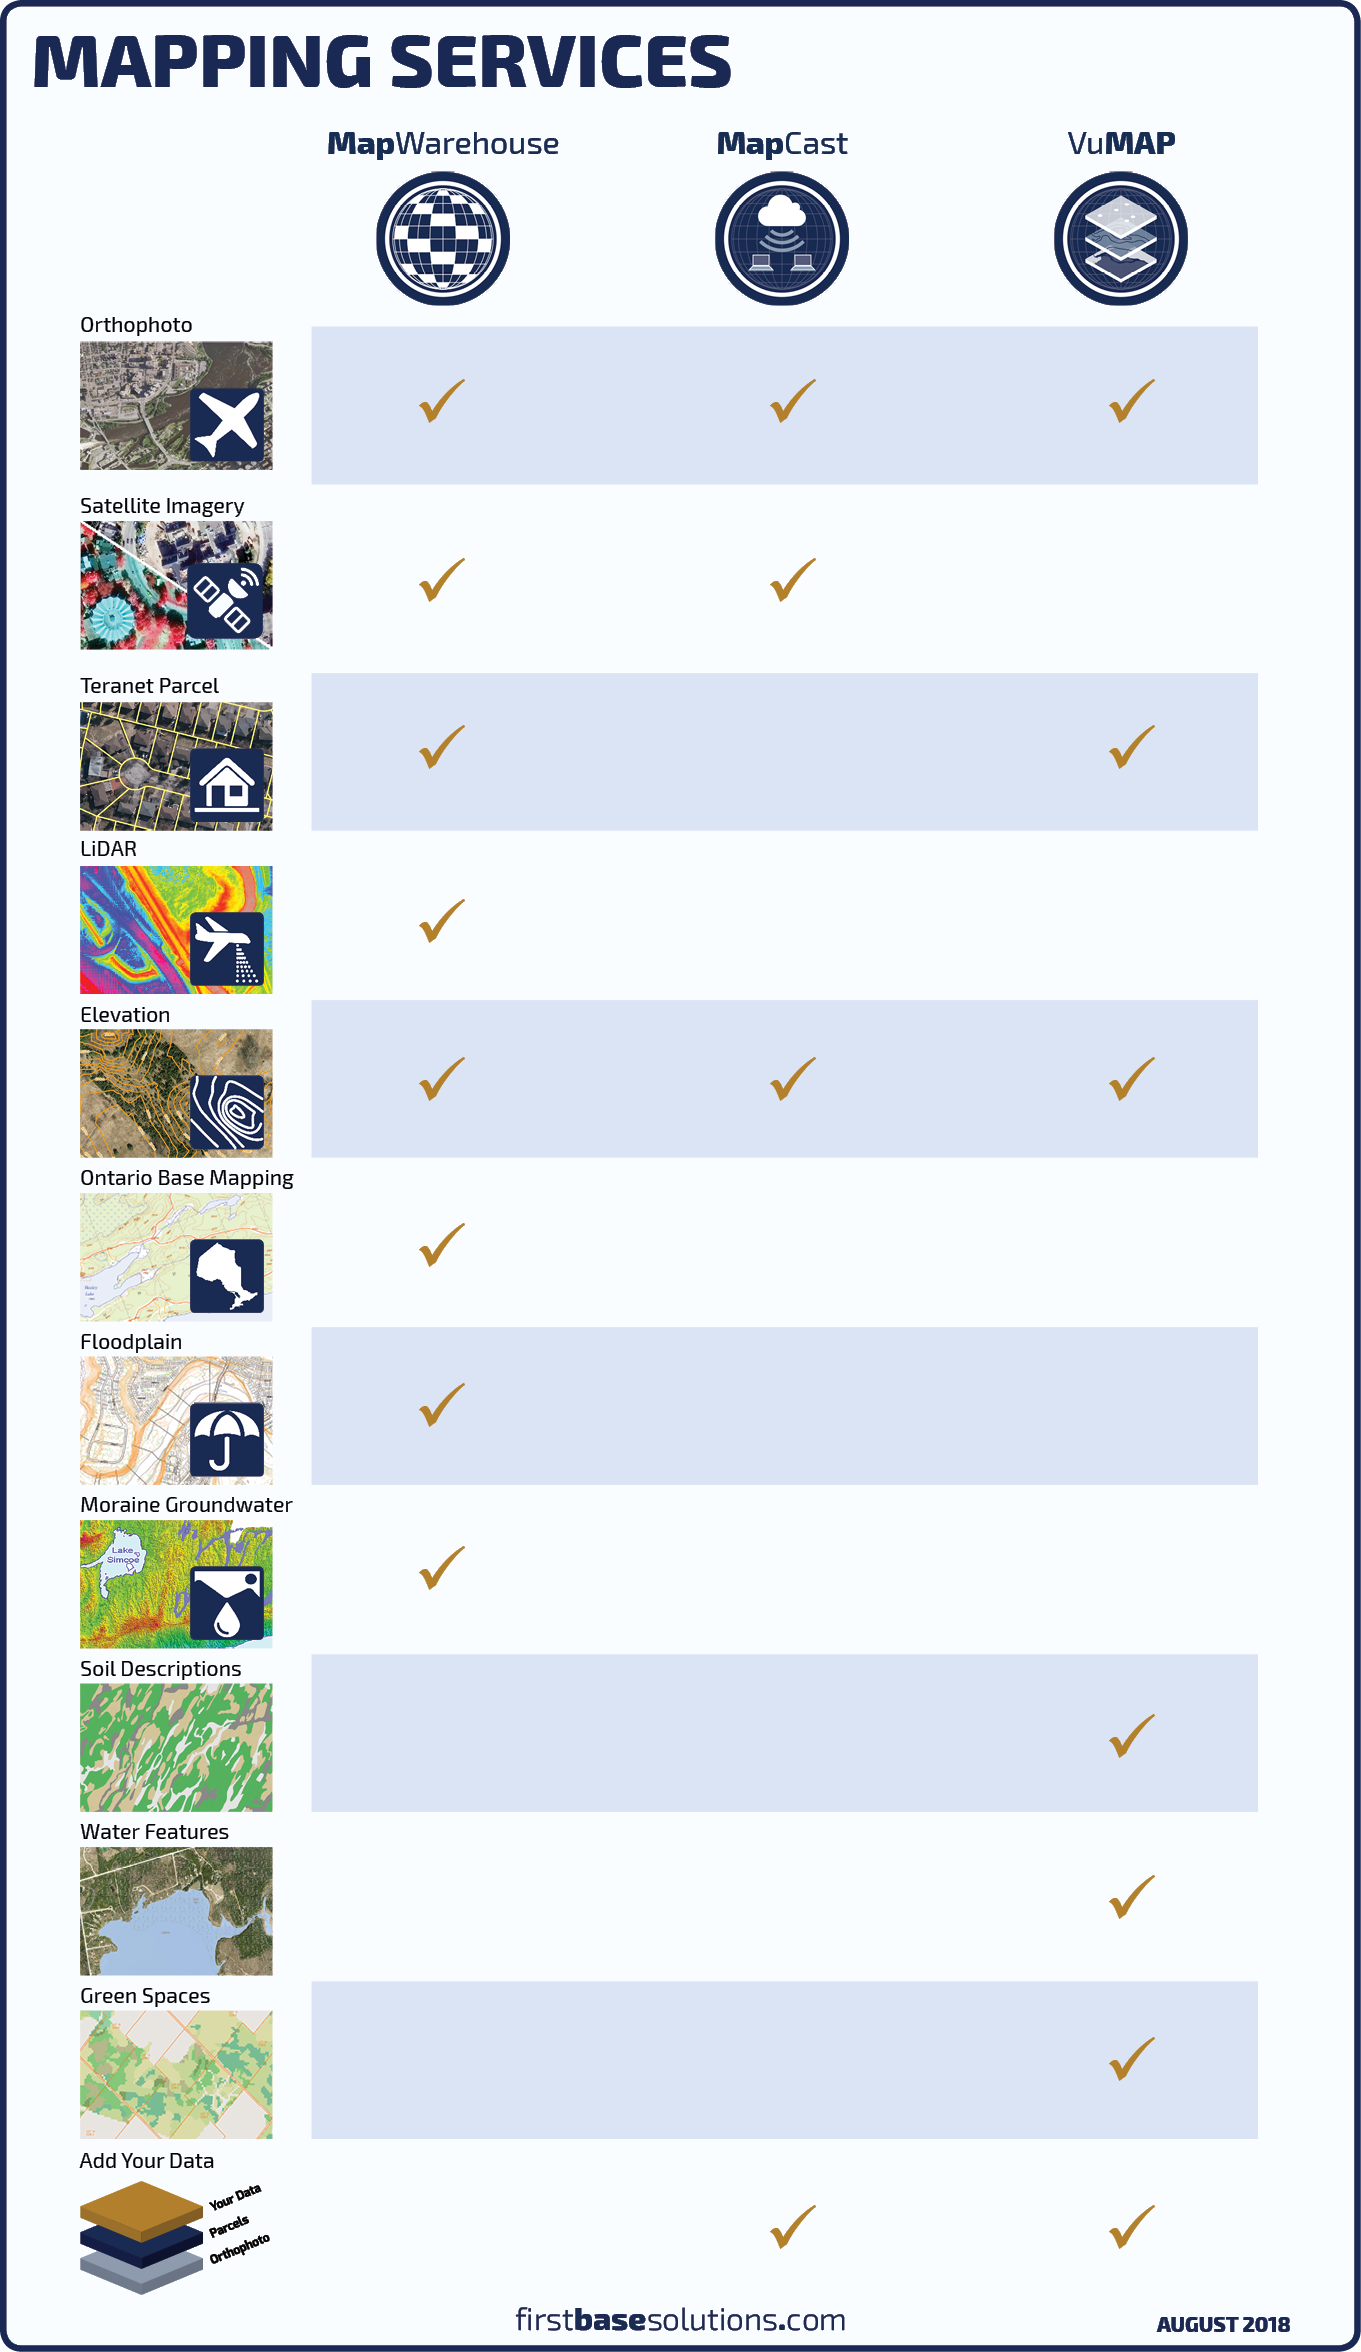
- 20. Compare Data Delivery ServicesAuthor: Salina Morrow
- 21. Can I piggyback on MapCast to sell and distribute my own high quality geo data collection?Author: Salina Morrow
Yes. First Base Solutions, hosts, distributes, and resells spatial data from qualified sources through MapCast, VuMAP, and MapWarehouse. Contact us about forming a reseller relationship at partnership@firstbasesolutions.com.
- 22. Can I use MapCast without CAD or GIS software?Author: Salina Morrow
Yes, you can. There are a few ways to do this. You can use the Google Earth application, or Google Maps in a web browser. In either case, the first step is to log in to the MapCast dashboard.
For Google Earth
1. Choose the 'KML Files' tab.
2. Click on the name of the region you'd like to view.
3. Google Earth will launch with your selected region listed under 'Temporary Places'.
Watch an example
For Google Maps
1. Go to Help page and choose the 'Code Samples' tab.
2. Copy and paste the Google Maps API code into a text editor and save it as an HTML file.
3. Open the file with an internet browser.
Watch an example
- 23. Which regions were flown this year?Author: Salina Morrow
Year by year breakdowns of historical image collection areas, resolutions of processed imagery, and the latest releases can be found here.
- 24. TroubleshootingAuthor: Salina Morrow
Please review the troubleshooting checklist here.

- 1. Compare Data Products
- 2. Is orthophoto different from aerial photo?Author: Salina Morrow
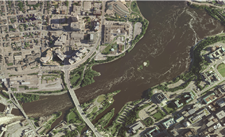
Yes. Orthophoto is produced by manipulating aerial photo to correct for movement of the aircraft and variations in the camera angle. Orthophoto has a top-down perspective and uniform scale, just like a map. Aerial photos are the original, unprocessed images. While they appear to be taken from an overhead viewing angle, they will inherently contain small distortions and can not be used as a map to accurately measure distance and direction like the orthophoto can.
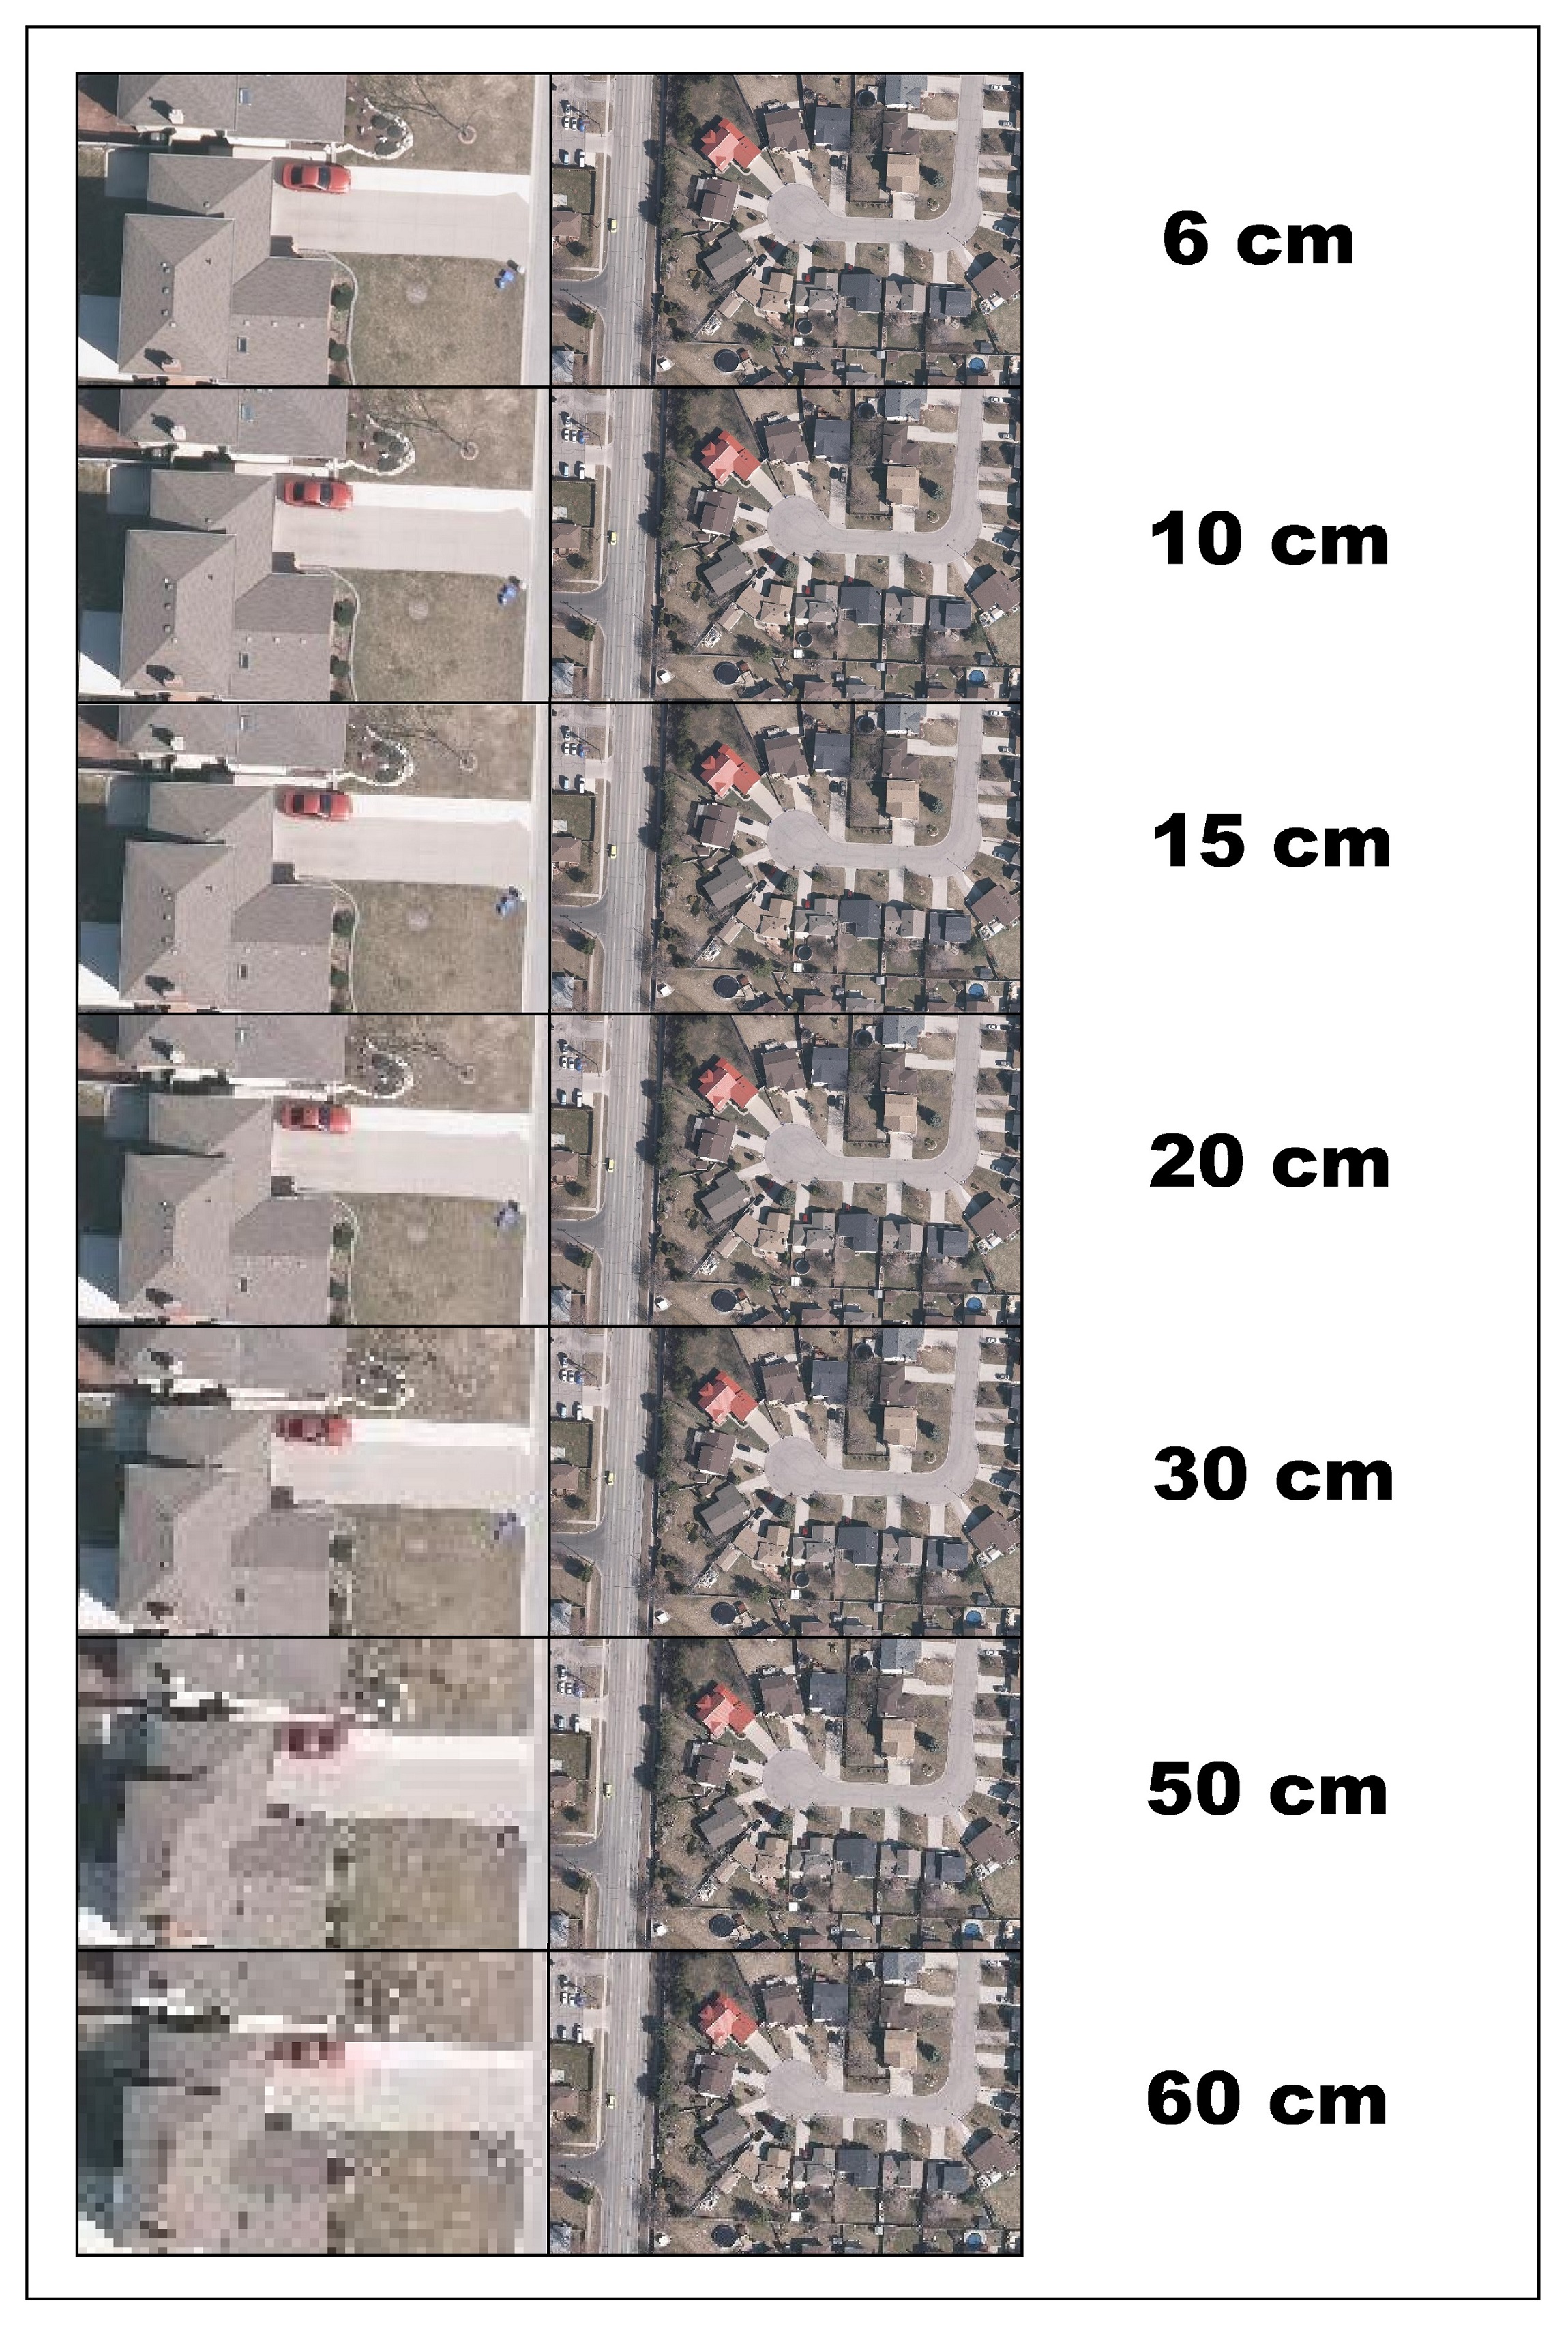
- 3. What does the photo resolution in cm mean?Author: Salina Morrow
Resolution in cm refers to the area on the ground covered by each pixel in the image. In an image with 15 cm resolution, for example, each pixel covers a patch of ground 15cm x 15cm in size. Objects on the ground which are smaller than that size will not be clearly visible in the image. In general, the smaller the resolution size, the more detail can be seen in the image.
- 4. What's the positional accuracy of the orthophoto?Author: Salina Morrow
It depends on the photo resolution. Whatever the stated photo resolution in cm, positional accuracy is double that value. A 15 cm photo, for example, has positional horizontal accuracy of +/- 30 cm. This means that for any point on the photo, the true location of that point on the ground will be within 30 cm of where it is located in the photo.
- 5. What's the difference between JPG and MrSid? What file format is best for my project?Author: Salina Morrow
JPG and MrSID are just a few compressed image formats. Both formats can be read by most up-to-date CAD and GIS software. JPG is a fine option where the goal is simply to view the imagery across as many platforms as possible and use it as a base layer to give context to your vector files. MrSID is the prefered choice where more demanding image manipulation or analysis will be involved and the resulting output needs to retain the data quality characteristics of the original.
JPG offers a reasonable balance between file size and image quality, and is most useful for images with smooth transitions between tone and colour. For this reason, JPG is easily the most popular format in digital photography and can be used with countless types of software . It does not hold up well to image processing or multiple edits, however, and can tend to lose detail of colour variation, causing a blocky appearance after decompression and recompression (posterization). FBS offers georeferenced JPG imagery by using an auxiliary *.WLD world file, which references the coordinates where the image tile should be inserted in the map, read by geo-capable software.
MrSID (multiresolution seamless image database) is a technology owned by LizardTech specifically for use with georeferenced imagery like orthophoto, which could have up to 8 - 16bit multispectral bands. The file size can be compressed up to 20:1 without degrading the image's appearance for RGB. Using MrSID format therefore allows very large files to be viewed quickly without the need to fully decompress the image. Furthermore, metadata like pixel resolution is inherent in the image and is updated automatically during processing.
- 6. How do I place my orthophoto in CAD software to align with other data tiles I bought?Author: Salina Morrow
For some users, simply change the extension of the world coordinate file that came with your JPG photo from *.wld to *.jgw, or, use a utility to read the wld file, which references coordinates of the top left corner of each image, accounting for a small buffer around the photo.
For some users, in the task pane, connect to data, add raster image or surface connection, choose the folder and files and add them to the map.
To insert a single image, create a new layer and use the coordinates that are embedded in the file name (see Q&A below) using the command, IMAGEATTACH to insert a single image. Use the easting value for the X-coordinate and add two zeros to the end, use the northing value for the Y-coordinate and add two zeros to the end. The scaling factor is 500, because a single tile is 500m x 500m. Use the command CDORDER to change the image drawing order to the back, behind your text and linework. The image will be attached as an Xref, so use the command ETRANSMIT to package your work if you intend to share your DWG file.
- 7. What do the numbers in the file name mean?Author: Salina Morrow
The first letters tell the data type, "orth" for orthophoto, "line" for a digital elevation model, "contour" for contour lines. The next 2 numbers are the UTM zone, usually 16, 17, or 18, for Ontario. The next 4 numbers are the easting value of the bottom left corner of the file, the next 5 numbers are the northing value for the bottom left corner of the tile. The next 4 digits are the year the data was captured. The last letters are the data owner, "fbs" for first base solutions, "tera" for teranet. For example, if the file name is orth171234567892012fbs.jpg. This is an orthophoto, taken by First Base Solutions in 2012. The UTM zone is 17, the X-value is 123400 and the Y-value is 5678900 for the lower left corner of the tile.
Learn More - 8. I'm using ArcExplorer, why doesn't my imagery georeference properly?Author: Salina Morrow
ArcExplorer is a free viewing platform with limited capabilities compared to the licensed versions of Arc software. Auxillary files containing coordinate system information (*.sdw for MrSID files) can not be read by ArcExplorer. Extent and coordinate system information must be embedded in the main file directly; this is normally achieved via ArcCatalog.
- 9. I need to do basic research with the orthophoto over a huge area which is going to run over budget and use my whole hard drive. Is there a way to just view the data without downloading it?
- 10. I'm looking for historical aerial photo. Can I get this through MapWarehouse?Author: Salina Morrow
MapWarehouse has digital photo dating back to 2000. Older photo taken on film can be sourced on a case by case basis by contacting our customer service.
- 11. Can I have several tiles merged into a single file?Author: Salina Morrow
No problem. Choose the photos you'd like to purchase, then contact our customer service and request the photos be mosaicked. Our staff can combine the tiles into a single large image while still maintaining the geographical referencing, provided the tiles you've chosen have the same photo resolution and file format. A fee for custom labour will apply for this service.
- 12. I need photos covering more than one tile, but I don't have software that can handle georeferenced data.Author: Salina Morrow
As long as you have an internet connection, you can use our VuMAP service to view the orthophoto and other data in context. Other options include having the tiles mosaicked into a single file, or, having a custom large format print produced. Contact customer service to request a quote.
- 13. Can I print orthophoto and use them with a stereoscope?Author: Salina Morrow
No. The topographic displacement where you might see the side of a tall building in the photo may seem deceiving, but orthophoto by definition have been rectified to remove perspective. Without two camera angles, stereo viewing won't work. The original uncorrected imagery can be retrieved upon request. Since each original photo has sufficient overlap with neighbouring images, stereoscopic viewing can be possible using two adjacent photos taken from our aircraft a few seconds apart.
- 14. Is it possible to get the date and time when the photo I just purchased was taken?Author: Salina Morrow
Yes, however, the photo tiles are made up of several photos stitched together. To locate the date and time for a tile, it is necessary to look up the flight plan to find the original photo most closely centered on the particular tile. The flight data is not available through the MapWarehouse website, but our customer service staff would be happy to look up the information for you.
- 15. Why are some orthophoto data sets labeled as "Winter", do they have snow cover?Author: Salina Morrow
All FBS orthophoto is cloud-free, snow-free, and leaf-free to ensure ground features are visible. Early Spring photos are sometimes taken prior to March 20, which is technically still Winter.
- 16. How do I order hard copy prints of custom photo maps?Author: Salina Morrow
FBS can produce large format custom printing of our digital data products. These printed maps typically include a large map portion with orthophoto, road labels and property lines, and a title block containing the title, scale, scale bar, north arrow, photo details, data source details and disclaimers, print date, our logo, and can include other data or labels you provide. We'll provide a sample soft proof for you to review and make changes. Pricing is dependent on a combination of labour, print size, map content, number of copies and whether the print will be on photo paper or mounted on a board, and, depending on your specifications, if it can be printed in-house or must be sent out to a specialty printing company. For a custom quote, please contact customer service and provide details of the geographical coverage, print size, and type of features you'd like to see on your map.
- 17. There's no orthophoto for my area, is there anything else available?Author: Salina Morrow
Yes. First Base Solutions can acquire new photo as a custom request. First Base Solutions is also a licensed reseller of DigitalGlobe and GeoEye satellite imagery. Satellite imagery is an ideal option for remote or inaccessible areas, and offers excellent value for large coverage areas with a moderate reduction in image resolution compared to imagery captured by aircraft. Contact us for a quote.
- 18. Why doesn't the property boundary line up perfectly with the orthophoto?Author: Salina Morrow
The orthophoto are generally spatially accurate to double the resolution value. Simply put, if a photo has resolution of 20cm, any point on the photo will be accurate within 40 cm of its true location. For the parcel data, different Land Registry Offices in Ontario were originally drawn to different standards and then later integrated into one dataset that's now maintained by Teranet. The most accurate being POLARIS (Province of Ontario Land Registration Information System) which is based on surveys, followed by BIM (Basic Index Mapping) which is based on 1:10,000 scale mapping or smaller, and Pre-BIM, which is compiled in areas where good control data is less available, making it the least positionally accurate. In an area where pre-BIM standards are used, it's not unusual for the property lines to be off by 10 m or more from where you would expect them to lie on the photo. Where your orthophoto and property lines don't align perfectly, it's likely due to different accuracy standards used to create one or both of the datasets.
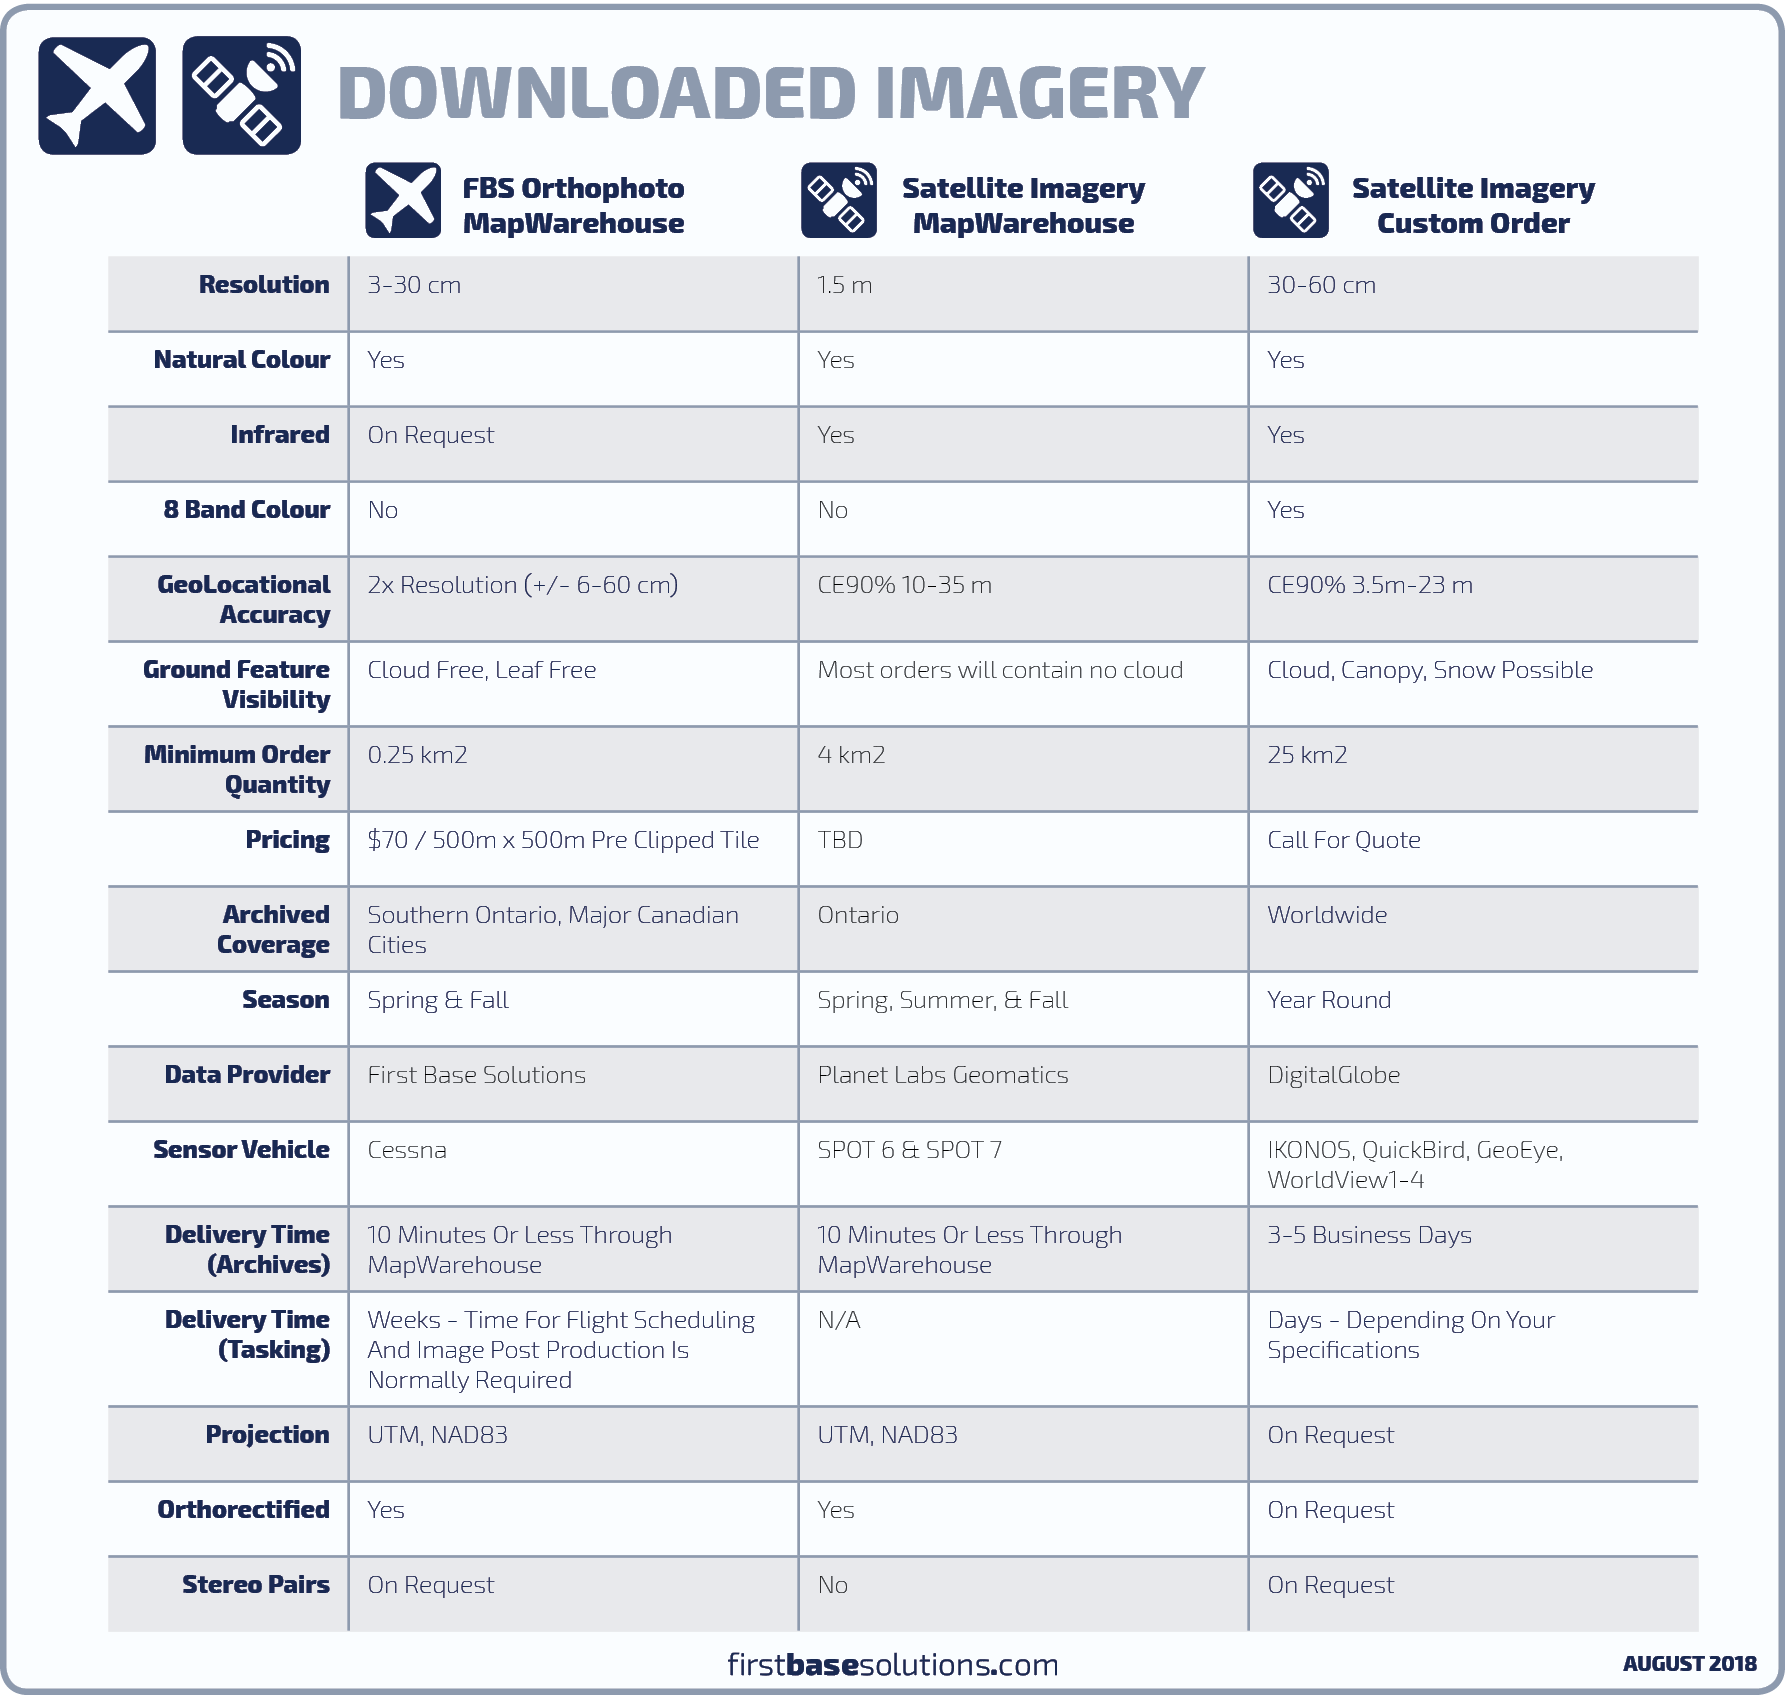
- 19. How does the quality of satellite imagery compare with orthophoto?Author: Salina Morrow
Each sensor vehicle is different. In general, the level of detail seen in the image and geolocational accuracy will be better for orthophoto flown from aircraft. Satellite imagery is superior in that new imagery can be collected and delivered on much shorter notice anywhere in the world, and includes more spectral bands outside the visible range.
- 20. How much does it cost?Author: Salina Morrow
Most downloadable data is priced based on 500m x 500m tiles. For most orthophoto, the cost is $70 per 500m tile, and $150 per 1km tile, with progressive discounts applied automatically for orders greater than 5 tiles. Vintage imagery may be priced lower in certain areas. Contours are $60 per tile. DEM are $60 per tile in Golden Horseshoe and $30 per tile for the Simcoe-Kawartha dataset.
LiDAR costs $100 per tile.Teranet parcels are $77 per tile at a flat rate, regardless of the number of parcels contained in the 500m square area. Property mapping can also be purchased as a custom order at $13 per parcel plus labour, with progressive discounts for orders over 10 parcels.
For Ontario Base Mapping, each map sheet is priced based on file format. View-only PDF or print copies are $15. Georeferenced raster copies (GeoTiff format) are $30. GIS and CAD formats are $100 per map sheet.
For Floodplain mapping, PDF maps are $30, CAD formats are $125 each.
Subscription based services such as VuMAP are priced based on the number of users, starting $1500 per year. MapCast subscriptions are priced based on bandwidth, starting at $500 per year for 500MB of bandwidth per month.
We are always open to providing custom services and solutions. Contact us directly to request a quote.
- 21. Can I get a sample file to try in my own software?Author: Salina Morrow
Yes! Several sample files are available in different formats on FBS University Please let us know if there's something more you'd like to see available.
- 22. What's the difference between raster and vector?Author: Salina Morrow
"Raster" refers to data made of pixels, like our orthophoto. Common raster file types you'll find on our website include JPG, MrSID, GeoTIFF and ECW. "Vector" refers to data made of points, lines, polygons, and often includes text elements as well. Common vector file types you'll find on our website include SHP, DWG, and DGN. Learn More
- 23. How is the data projected? Can I change the projection to suit my project?Author: Salina Morrow
Data is in UTM NAD83(original) in most cases, Zone 17N unless otherwise specified. While converting datum and projection settings for vector files is a simple task for most users, the same operation with raster data like orthophoto may require a higher level of expertise. Conversion to other datums such as MTM NAD27 Zone 10, which is typical for City of Toronto data, is a service FBS can provide. A fee for custom labour would apply. Contact us for a quote.
- 24. I'm using the data for academic, research, or non-commercial purposes. Do you offer educational-use licensing or discounts?Author: Salina Morrow
For FBS's own products such as orthophoto and elevation models, we may be able to provide such a discount. Call us to discuss what you're planning to do. Partner data such as Teranet parcel fabric is subject to the existing licensing agreements. FBS does not have discretion to re-price our partners' data.
- 25. Can I see an overview of the the area each dataset covers?Author: Salina Morrow
From the coverage map, click the magnifying glass beside the name of any data set and the extent of the coverage will be highlighted in pink on the map.
- 26. How do I reference maps from FBS as cited works?Author: Salina Morrow
It depends on the map and it's source. A full explanation can be found here.
- 27. Compare Downloadable Imagery Sources
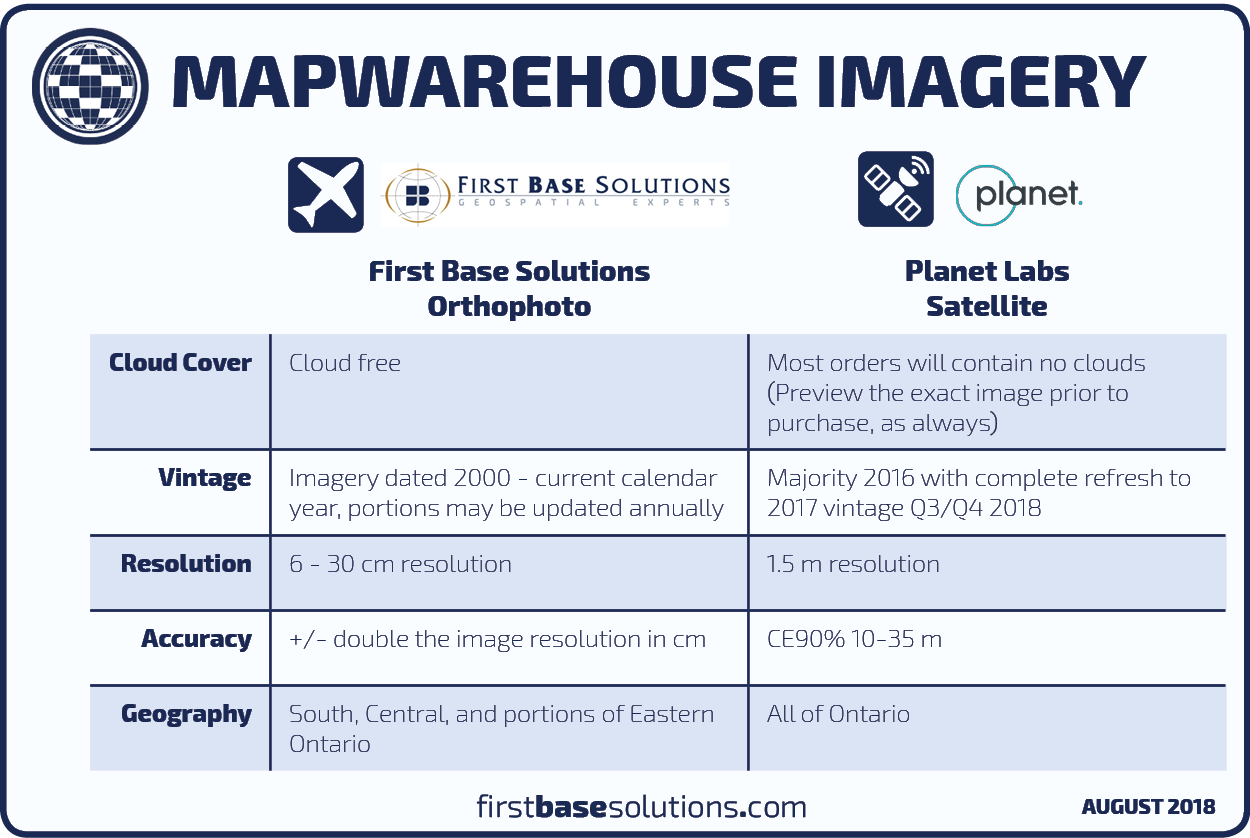
- 28. What's The Difference Between MapWarehouse's Orthophoto and Tiled Satellite Imagery?
- 29. Can I preview the exact image I'll receive before buying it?Author: Salina Morrow
Yes. From the item selection list in MapWarehouse, click the info icon beside any item to see it's metadata and a thumbnail of the actual image you'll receive. The Google base map is just to help you locate your area of interest.
- 30. Is there anything newer?Author: Salina Morrow
We update large portions of our aerial imagery every year to keep up with demand for new data, especially in suburban areas where land development is taking place. In the built environment, the imagery will be different every single year, so it's worth the effort to fly the same areas over and over.
The same is true for many types of "cultural" features such property line boundaries. Not every parcel changes every year, but within our large database covering all of Ontario, enough parcels change to need scheduled updates to maintain the relevance of the information a few times a year.
Not so, however, with other types of mapping. One of our most popular data products is elevation mapping which was produced in 2002. Since our DEM and contour mapping is looking at bare earth topography, and the lay of the land doesn't generally change, there's no reason to update the data based solely on its age.
There are a few exceptions. Activities that change the landscape such as mining, dam building, and urban expansion would require an updated map if those activities took place at your area of interest since the DEM was produced in 2002.
- 31. Which regions were flown this year?Author: Salina Morrow
Year by year breakdowns of historical image collection areas, resolutions of processed imagery, and the latest releases can be found here.
- 32. The sample download doesn't workAuthor: Salina Morrow
If you're having trouble with the sample request form, you can also access a selection of data here:
Orthophoto
Parcel
Elevation
Flood Lines
Ontario Base Mapping
Oak Ridges Moraine Groundwater
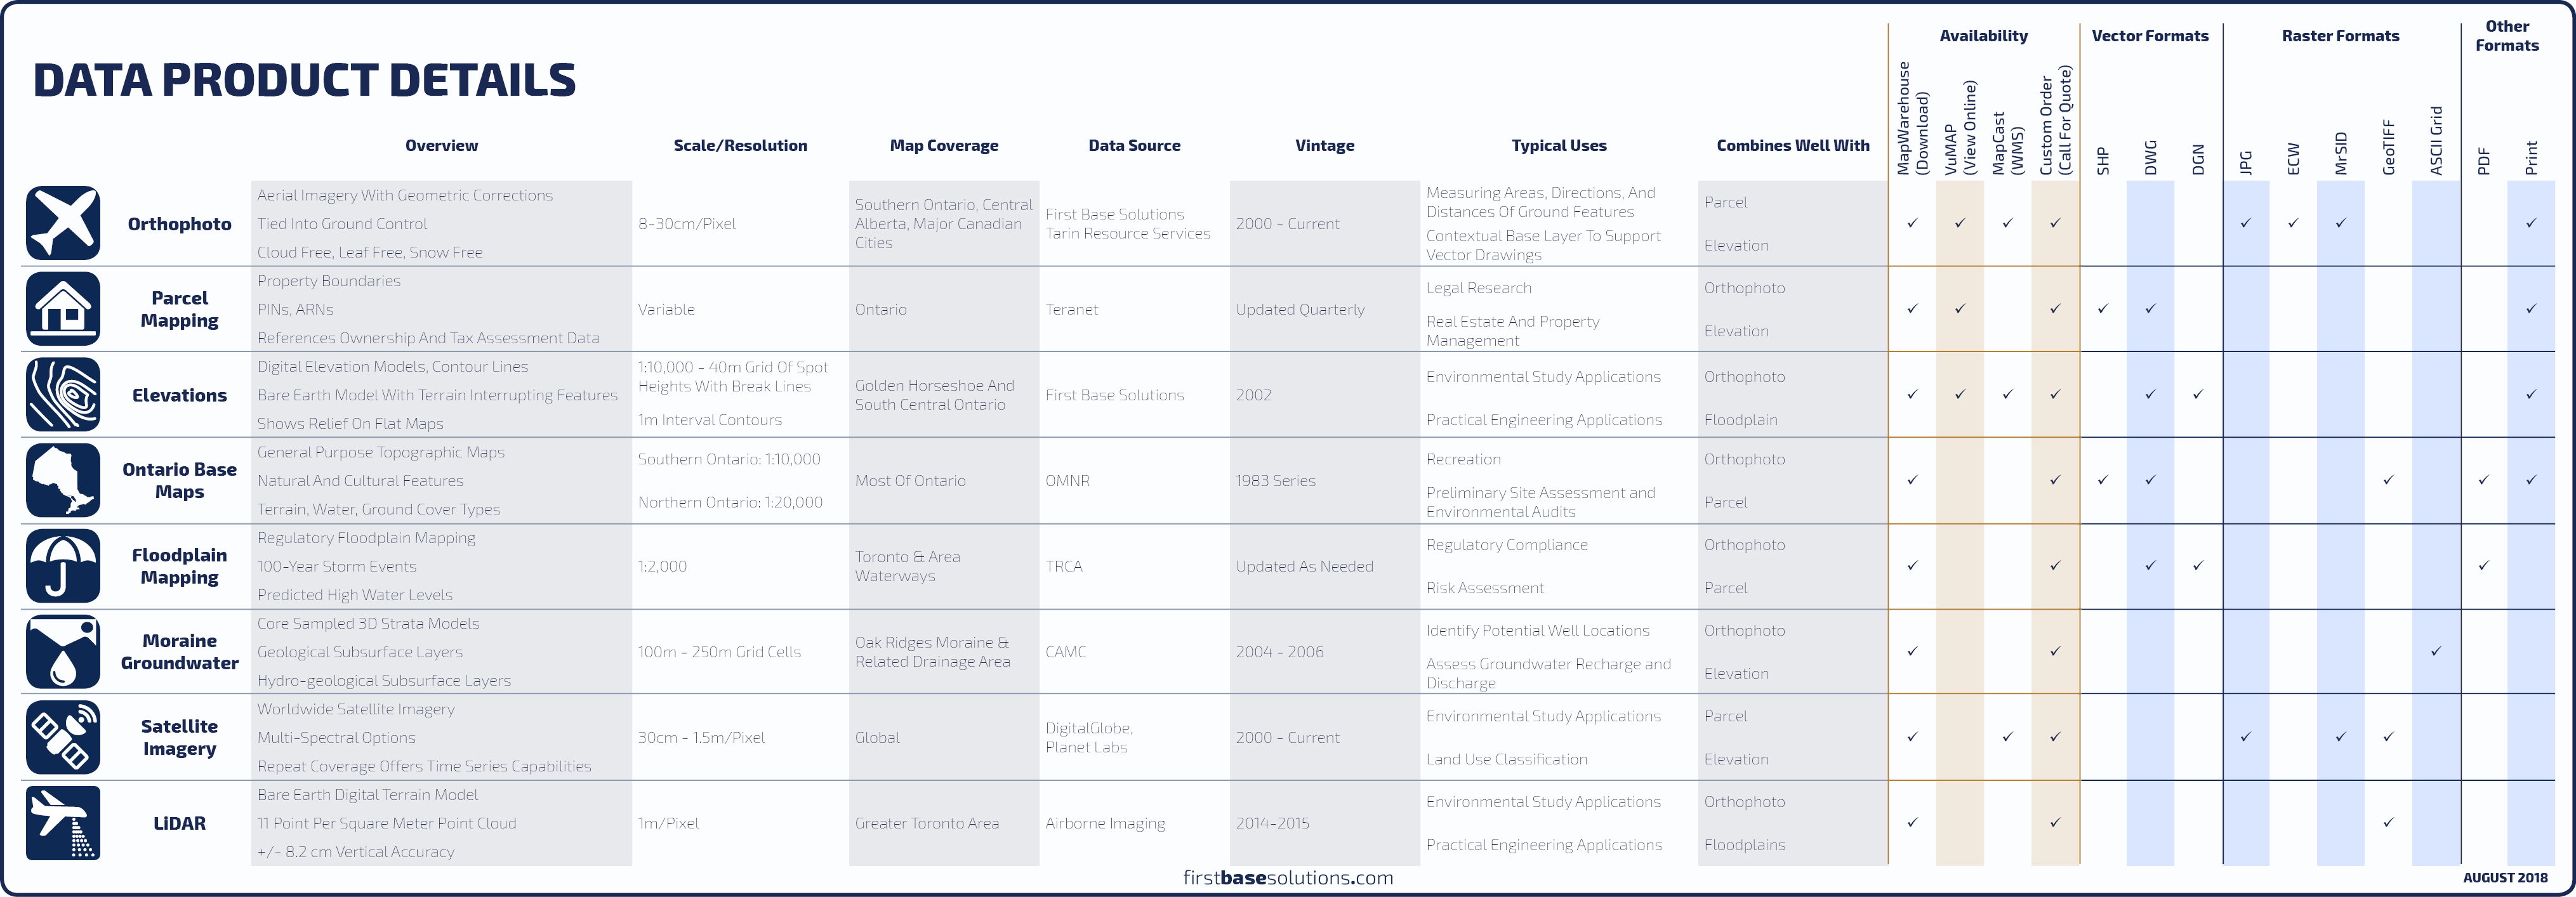
- 1. Compare Data Products
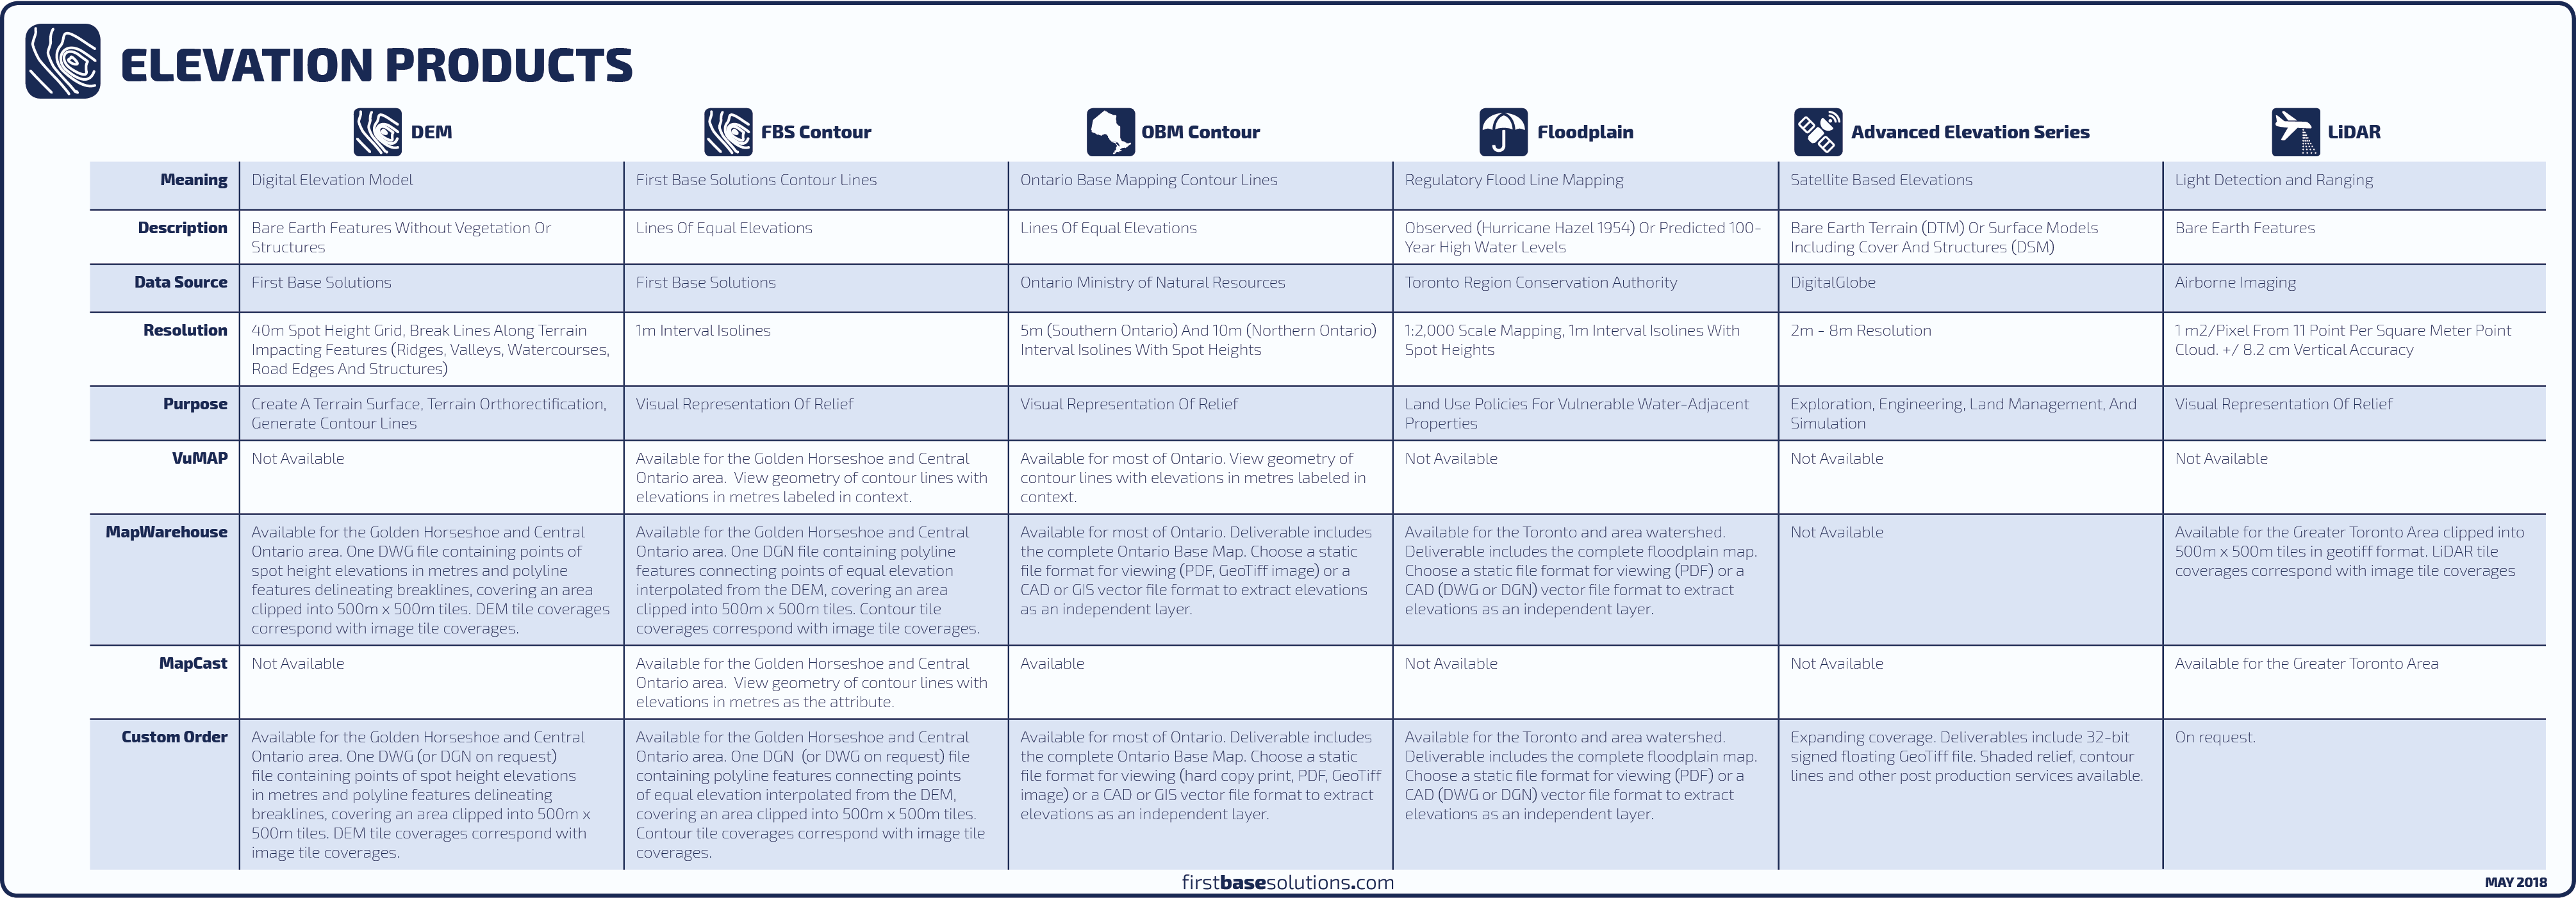
- 2. What's the difference between contours and DEM?Author: Salina Morrow
The DEM capture was produced from 2002 orthophoto at 1:10,000. It includes elevations on a 40m grid spacing together with break lines along all visible terrain impacting features (road edges, drainage, etc.) The DEM is a representation of a topographical surface, specifically a regular grid of spot heights and break lines (noticeable changes in slope). The file is available in UTM NAD83 in DWG format. The DEM does not contain contours, but they can be generated from the DEM.
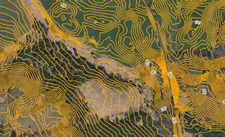
The contour file is a separate product that is derived from the DEM. The contour interval is 1m.
If you have the software to generate contours from the DEM, then all you would require is the DEM and produce the contours yourself. The contours became available for those users who do not have this software ability.
- 3. How can I generate a contour file or tin surface from the survey points and break lines in a DEM?Author: Salina Morrow
Here are tutorials that demonstrate the general process, although a some steps such as creating the break lines have already been done by First Base Solutions.
Youtube: Civil 3D Surface Creation
Youtube: Terrain Model from Survey Points - 4. What are the intervals of the contours? Can I get sub-metre intervals?Author: Salina Morrow
The contours provided in tiles by FBS on MapWarehouse are in 1m intervals. In any area where high resolution orthophoto is available, it is usually possible to produce a more detailed elevation model. Contact us for a quote.
- 5. What's the positional accuracy of the elevation data?Author: Salina Morrow
In the 2002 Golden Horseshoe data set, the horizontal and vertical accuracy is +/- 40 cm, and +/- 80 cm for the 2002 Simcoe-Kawartha data set. This means that the difference between the true elevation on the ground compared to what's shown in the digital file can be as great as 40 cm or 80 cm. The most accurate areas will be those with excellent ground visibility in the source orthophoto which the elevation model was derived from. Areas with dense forest, especially coniferous forest where the ground is obscured, tend to have the lowest accuracy.
- 6. I thought I was getting a complete map but this file is just a bunch of lines. Where are the road labels and other features?Author: Salina Morrow
Only elevation information is included, either as DEM or contour, depending on the file you've chosen. The road edges frequently appear as break lines in the DEM, giving the appearance of unlabeled roads. There are a few options to give context to to the surrounding area. You can take advantage of the georeferencing inherent in the elevation data file and use it with your own spatial data you've collected for your project as a background layer. If you don't have your own data, the tile grid for elevation data coverage is the same as for orthophoto and Teranet parcel coverage. Users often purchase a few files of different data types for the same grid cell. The user can then use the orthophoto as a background layer and add elevation data on top, both files having identical geographical coverage. In this way, users can select data a la carte and pay for only the layers and coverage needed.
- 7. Why are there sometimes negative values for elevation in the DEM?Author: Salina Morrow
Some tiles have 1000m vertical shift applied, to work with a different global origin. For example, a value of -800m should be considered +200m.
- 8. I'm looking for contour for a large area and I don't really need the level of detail that comes with FBS 1m contours. Is there a more economical option suitable to my project?Author: Salina Morrow
Yes! We have OBM (Ontario Base Mapping) available in a variety of vector formats such as SHP and DWG. These maps were produced in 1983 by Ontario Ministry of Natural Resources at 1:10,000 (5km x 5km sheets)and 1:20,000 (10km x 10km sheets) for southern and northern areas respectively. These maps show, among other features, contours at 5m intervals in the south and 10m intervals in the north. We can also source worldwide coverage of elevation models through our partnership with DigitalGlobe. Contact us for quote.
- 9. I can't find the elevation data for my area in MapWarehouse. How can I get this information?Author: Salina Morrow
It's usually possible to produce a highly detailed custom elevation model using current orthophoto or satellite imagery, where this imagery exists. Contact us for a quote. We also have 1983 OBM (Ontario Base Mapping) for the entire province which has 5m interval contours in southern Ontario and 10m interval contours in northern Ontario.
- 10. I've purchased adjacent tiles of contour lines. How can I connect all the lines end to end at the tile boundaries?Author: Salina Morrow
Copy the line work from one file, open the file for the adjacent tile and use the command "paste to original coordinates" to have them together in one DWG. Use the command PEDIT (polyline edit). Select M (multiple), and choose all the linework from both tiles and hit enter. You will be prompted with, "Convert Lines and Arcs to polylines?" choose Y (yes), then enter the option J (join), the join type is "extend". Enter a small fuzz distance 5 (mm). The line work from adjacent tiles with identical elevation values will be joined into single line features.
- 11. How much does it cost?Author: Salina Morrow
Most downloadable data is priced based on 500m x 500m tiles. For most orthophoto, the cost is $70 per 500m tile, and $150 per 1km tile, with progressive discounts applied automatically for orders greater than 5 tiles. Vintage imagery may be priced lower in certain areas. Contours are $60 per tile. DEM are $60 per tile in Golden Horseshoe and $30 per tile for the Simcoe-Kawartha dataset.
LiDAR costs $100 per tile.Teranet parcels are $77 per tile at a flat rate, regardless of the number of parcels contained in the 500m square area. Property mapping can also be purchased as a custom order at $13 per parcel plus labour, with progressive discounts for orders over 10 parcels.
For Ontario Base Mapping, each map sheet is priced based on file format. View-only PDF or print copies are $15. Georeferenced raster copies (GeoTiff format) are $30. GIS and CAD formats are $100 per map sheet.
For Floodplain mapping, PDF maps are $30, CAD formats are $125 each.
Subscription based services such as VuMAP are priced based on the number of users, starting $1500 per year. MapCast subscriptions are priced based on bandwidth, starting at $500 per year for 500MB of bandwidth per month.
We are always open to providing custom services and solutions. Contact us directly to request a quote.
- 12. Can I get a sample file to try in my own software?Author: Salina Morrow
Yes! Several sample files are available in different formats on FBS University Please let us know if there's something more you'd like to see available.
- 13. What's the difference between raster and vector?Author: Salina Morrow
"Raster" refers to data made of pixels, like our orthophoto. Common raster file types you'll find on our website include JPG, MrSID, GeoTIFF and ECW. "Vector" refers to data made of points, lines, polygons, and often includes text elements as well. Common vector file types you'll find on our website include SHP, DWG, and DGN. Learn More
- 14. I'm using the data for academic, research, or non-commercial purposes. Do you offer educational-use licensing or discounts?Author: Salina Morrow
For FBS's own products such as orthophoto and elevation models, we may be able to provide such a discount. Call us to discuss what you're planning to do. Partner data such as Teranet parcel fabric is subject to the existing licensing agreements. FBS does not have discretion to re-price our partners' data.
- 15. Can I see an overview of the the area each dataset covers?Author: Salina Morrow
From the coverage map, click the magnifying glass beside the name of any data set and the extent of the coverage will be highlighted in pink on the map.
- 16. How do I reference maps from FBS as cited works?Author: Salina Morrow
It depends on the map and it's source. A full explanation can be found here.
- 17. Compare Elevation Products
- 18. How can I use the elevation attributes to label my contour lines in CAD?Author: Salina Morrow
You will need to create an attribute definition. Here are a few articles that describe the process:
How to: Label Coordinate in AutoCAD
Tutorial: Create attributes - 19. Is there anything newer?Author: Salina Morrow
We update large portions of our aerial imagery every year to keep up with demand for new data, especially in suburban areas where land development is taking place. In the built environment, the imagery will be different every single year, so it's worth the effort to fly the same areas over and over.
The same is true for many types of "cultural" features such property line boundaries. Not every parcel changes every year, but within our large database covering all of Ontario, enough parcels change to need scheduled updates to maintain the relevance of the information a few times a year.
Not so, however, with other types of mapping. One of our most popular data products is elevation mapping which was produced in 2002. Since our DEM and contour mapping is looking at bare earth topography, and the lay of the land doesn't generally change, there's no reason to update the data based solely on its age.
There are a few exceptions. Activities that change the landscape such as mining, dam building, and urban expansion would require an updated map if those activities took place at your area of interest since the DEM was produced in 2002.
- 20. The sample download doesn't workAuthor: Salina Morrow
If you're having trouble with the sample request form, you can also access a selection of data here:
Orthophoto
Parcel
Elevation
Flood Lines
Ontario Base Mapping
Oak Ridges Moraine Groundwater


 Blog: MapCast Troubleshooting Checklist


 Learn More