As a new subscriber to MapCast, you'll need to connect to the service before you can get to work. On the MapCast dashboard there are five options. Here I'll recommend which connection type to use and when.
Your service connection type will depend on the software you plan to use.
First, a quick overview of what you can do with MapCast based on the connection type you choose. In all cases, MapCast delivers image tiles at various scales which are displayed in turn as the user zooms in or out. The user has access to view the data, not direct access to the data itself, therefore, it can not be manipulated, saved or edited.
If you can use Google Maps, then you're already an expert. It's much easier than you think.
What's a TMS?
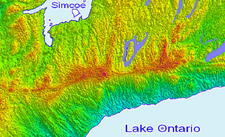
TMS is a Tile Map Service. Aerial imagery from our planes is processed to create a highly detailed photo map that covers Southern Ontario. A grid is used to split the photo map into thousands of small tiles. Read more »
Online Store
Locate your area of interest on a map and search for data covering that area. Add items to your cart, enter a credit card, then download the files. Save the data locally to use in your CAD or GIS based project.
Web Mapping Service Your team’s annual subscription serves an aerial image base layer and contour elevations directly into your CAD or GIS software. No large files to download or store. Go Now | Learn More
Online Application Your annual subscription allows unlimited access through a web browser to view the same data as found on MapWarehouse and more, plus easy to use built-in tools to analyze, plan, and communicate spatial information.
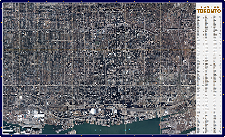
Aerial imagery gives us technology to look at history from a new perspective. Test your knowledge of local history sites below. Question 1. What’s this site in Toronto known for?…
If you want to quickly learn how to use a WMS (web mapping service) to stream aerial imagery and geographic data into your desktop GIS or CAD software, or just want to improve your skills and learn a few tricks of the trade, this video will get you up to speed quickly with real world examples. Watch the videos and follow the transcript below.
In this this video you will learn how to Connect to MapCast, Display aerial imagery and elevation contours, Analyze your own mapping data in context, and Explore year over year changes in land use patterns.
Here’s how it works:
MapCast is a web map service, or WMS for short.
Zoom to any location in your mapping software of choice, turn MapCast on and instantly see high resolution aerial imagery and 1m elevation contours from First Base Solutions to satisfy your need for site specific details without the hassle and expense of visiting a remote location.
If your mapping projects routinely require you to spend time hunting for reliable geographic data for multiple locations, and the upfront costs to acquire that data – even if you’re just at the proposal stage and those costs may never be recoverable – then you should give MapCast a try.
MapCast is a must have mapping tool for anyone who works in land development, engineering, agriculture co-ops, natural resources management, land use planning, or anyone who designs or manages large scale projects or extensive networks of properties, such as energy distribution infrastructure.
You will save time and money on your preliminary site research without the commitment of purchasing data outright in advance!
It’s easy to use
MapCast allows your team to access the entire collection of FBS imagery and contours through the desktop CAD or GIS software you already use. Simply add data to your map project and choose a connection to MapCast instead of data stored locally.
It’s easy to maintain
Share the connection URL with your team members and check your dashboard to monitor usage. MapCast is the most efficient and cost effective way for teams to access large datasets without the need to store, manage, or process large files that can slow down your internal networks.
It scales to your budget
Email alerts and custom reports let you track your team’s usage. Bandwidth sharing lets each person on your team use the service as much or as little as they need, and bandwidth top ups are automatic so you’ll never run out.
Let’s learn how to use MapCast in four easy steps:
Lesson 1: Connect
Subscribe
To start your subscription, contact customer service and we’ll establish a user account for your company based on the bandwidth you expect to use in an average month.
Typical commercial users consume about 500 MB per team member per month. That breaks down to about 260 images served – whenever you pan, zoom, or refresh. Each image is delivered in 256 KB tiles. The number of tiles per image will vary based on the size of your monitor and the size of the map window in your software. In months where your team’s combined bandwidth usage is above the monthly limit, you’ll be topped up automatically so you’ll never run out in the middle of an important project.
Log In
Once your account is set up, navigate to fbswms.firstbasesolutions.com and enter your user name and password. The first time you log in, you’ll be asked to review and accept the end user licence agreement. When you’re ready, click OK to move on to the dashboard.
Copy the URL you find at the top of the page. This is your unique link that you can share with any team members who will be using your account. Next, open your favourite WMS compliant software.
Consult the help files for your specific software to locate the WMS options since the steps may be different from my examples. Under the help menu you will also find FAQ’s, code samples if you’re connecting through a tile map service, and a list of the available data layers.
Load the WMS
If you’re connecting through Google Earth, navigate to the KML files and download the file for your area of interest. Open the file and it will load in position on the google Earth globe. The quality of the MapCast aerial imagery will be immediately obvious when compared to the Google satellite base layer.
Microstation users can similarly download a file for their area of interest. Be sure to first choose the projection you’d like from the dropdown menu at the top of the page.
For the rest of the tutorial I’ll use ArcMAP.
Add data to your new project and navigate to your ‘Add WMS‘ option. When prompted to add a URL, paste the URL that you copied from your MapCast dashboard. Choose version 1.1.1 in most cases, and load the available layers. Now that your unique URL is set up, add the FBSWMS to your list of WMS sources, then add it as the first data layer in your project. Click to turn the layer visibility on and you’ll see part of the imagery draw on your screen.
The hard part is over!
You’ve now completed the Connect portion of the tutorial.
Lesson 2: Display
Set Up
In my ArcMap example, I’ll add in a world countries layer to give some context to the MapCast imagery.
Expand the MapCast layer and you’ll see the imagery that’s available arranged in a hierarchy of three levels, grouped geographically by province, then by county, then by year if the county has multiple imagery sets available. Check all imagery sets you’d like to be visible, and don’t forget to also turn on the county and province groups the imagery is grouped under. Contour elevations can be found at the top of the list for Ontario.
Initially the map is displayed with a plain old geographic projection, but since I’m going to be working in the Toronto area, I’m going to change the coordinate system for the MapCast layer to NAD83 UTM, zone 17N, which is the most common projection for working in South Central Ontario. You can see the effect this has the shape of Western Canada since the map is now focused on Ontario.
Open the properties for all layers and you’ll see the coordinate system change has been applied there as well. Zoom in on Ontario and you’ll see the shape of the region looks familiar and undistorted using this projection.
Properties
The properties dialogue shows the same types of properties you’d see in any other type of layer. Here you can rename the layer and set the scale range. The data source is the URL you copied and pasted earlier.
To streamline the tree structure in the table of contents, you can choose only the layers you’re actively working with under the layers tab. Only the layers listed on the right will be available until you change the setting. This is good practice to help save bandwidth since you’ll be temporarily unable to draw layers outside your area of interest.
The visibility, zoom, and pan options work the same as with any other layer. Here I’m only interested in Peel region, so I’ll turn the other layers off to save bandwidth.
Caching
Another way to save bandwidth is to use image caching. The cached image will be temporarily saved so doesn’t need to be reloaded until you zoom, pan, or make a new image layer visible. This feature will increase the speed and performance if your work tends to keep you in the same area of the map for a long time.
You’ve now completed the Display portion of the tutorial.
Lesson 3: Analyze
Contours
There are two types of contours available for Ontario: FBS, which is from First Base Solutions in 1m intervals, and OBM, which is from the Ministry of Natural Resources Ontario Base Maps in 5m and 10m intervals.
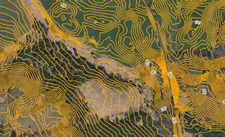
Since the FBS contours are so detailed, they will only draw when you’re zoomed in closer than 1:37,500 by default. In the table of contents, the visibility is checked on, but greyed out until I zoom in close enough.
Zooming in even closer allows you to interpret topography at the neighbourhood level, for instance, following the points in this V shaped pattern, I can identify the bottom of a valley where there is likely to be a small stream with the V’s pointing up hill away from this pond.
Measure
In addition to analyzing topography, you can take advantage of many of the tools built in to your CAD or GIS software. Let’s take a really close look at the imagery. Most of our imagery is between 10 and 20 cm resolution, meaning each pixel covers 10×10 or 20×20 cm on the ground.
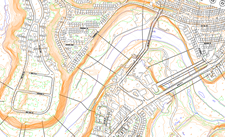
Because the imagery is orthorectified, meaning it’s been geometrically corrected for the movement of the aircraft, it can be used to accurately measure area of features on the ground, and distance and direction between objects seen in the photo, just like a map.
At this zoom level, it’s easy to see roof top objects, road markings, and even individual people. Since we’re using a UTM projection, we can measure in square meters with ArcMap’s measure tools and find the area of this minivan.
Your Data In Context
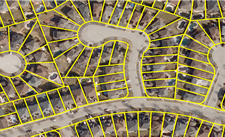
I’ve gone to MapCast’s sister service, MapWarehouse, to purchase and download some parcel mapping data which I’ve added to my mapping project. As you can see, the property boundaries line up perfectly with the MapCast imagery. Without the imagery below to show the location of structures and the types of land use, the parcels don’t have much meaning on their own.
I’ve also used the imagery as a base layer to create my own highly detailed vector base map by tracing objects on the ground. Building footprints, fence lines, curbs and sidewalks, tree canopies, street lights and other details of the busy urban environment are much faster and easier to survey from the imagery than by undertaking a ground level study of the area.
You’ve now completed the Analyze portion of the tutorial.
Lesson 4 Explore
Historical Conditions
MapCast lets you explore past conditions at your site with historical imagery. I’ll zoom in to an area near the airport where I know there’s been some development. For this area, I have already loaded the imagery for Mississauga 2008 and 2014, and Peel Region 2015 which contains Mississauga. By switching the visibility of the 2008 and 2014 imagery off and on, I can see the new UP express tracks leading in to the terminal.
The 2015 imagery shows even more changes to the parking lots and roads surrounding the Up express project. Let’s zoom in for a closer look. Now look back at 2008 and see what the area looked like under construction.
Using landmarks you see in the historical imagery that existed in the past is an easy way to position your historical vector mapping data. Once you turn on the current year, updating portions of your legacy files can be done quickly and efficiently by digitizing over the changes you see in the image. Here you can see changes to the woodlot where the 407 extension was built.
Layering
Most areas in Ontario have multiple image sets listed by year as you can see in tree structure. The data ranges in age from 2002 up to the current or previous calendar year, but not all areas are updated every year.
As with most mapping software, the data draws in the order you see listed in the table of contents, starting from the bottom and working up. When working with two imagery layers from different years that cover the same geographical area, the top most visible layer in the drawing order is the only one that you’ll see because the imagery is opaque. All layers below, even though set as visible, will be covered until the top drawing layer is turned off.
You can adjust the drawing order of the layers under the Layers properties by using the up and down arrows on the right. Keeping the layers in chronological order will be helpful to managing the data in your project more intuitively. All imagery is taken in early Spring, unless otherwise noted as Fall imagery, this is done so ground features will always be visible without being obscured by foliage.
In situations where you want to simultaneously view two images at once, the transparency can be adjusted. Transparency must be applied to the entire MapCast layer, but not for or between individual layers.
If you need to see two layers at the same time, duplicate your MapCast connection in the table of contents and adjust the transparency properties separately. This is a helpful workflow if you need to assess major land use changes where the before and after images may be so different there are no landmarks left on the ground to orient what you’re seeing.
Working With Repeat Coverage
If you need to research historical conditions to support a legal action, to assess property values or changes to the environment, for example, MapCast imagery provides objective, date stamped documentation of past conditions that makes it easy to visualize changes to the landscape over time and communicate the information with others.
Here I’m creating a simple layout to share with a co-worker, noting the new swimming pool on this property. Changes requiring permits such as this are simple to see in the imagery, but would be difficult to assess from the road. The imagery also makes it easy to confirm bylaw compliance, such as proper fencing and setbacks from property lines using the measurement tools we looked at earlier.
If you need imagery updated or for a specific location, you can contact First Base Solutions about a quote for custom aerial imagery acquisition services, topographic mapping, or any type of custom map compilation.
You’ve now completed the Explore portion of the tutorial.
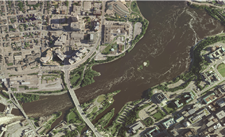
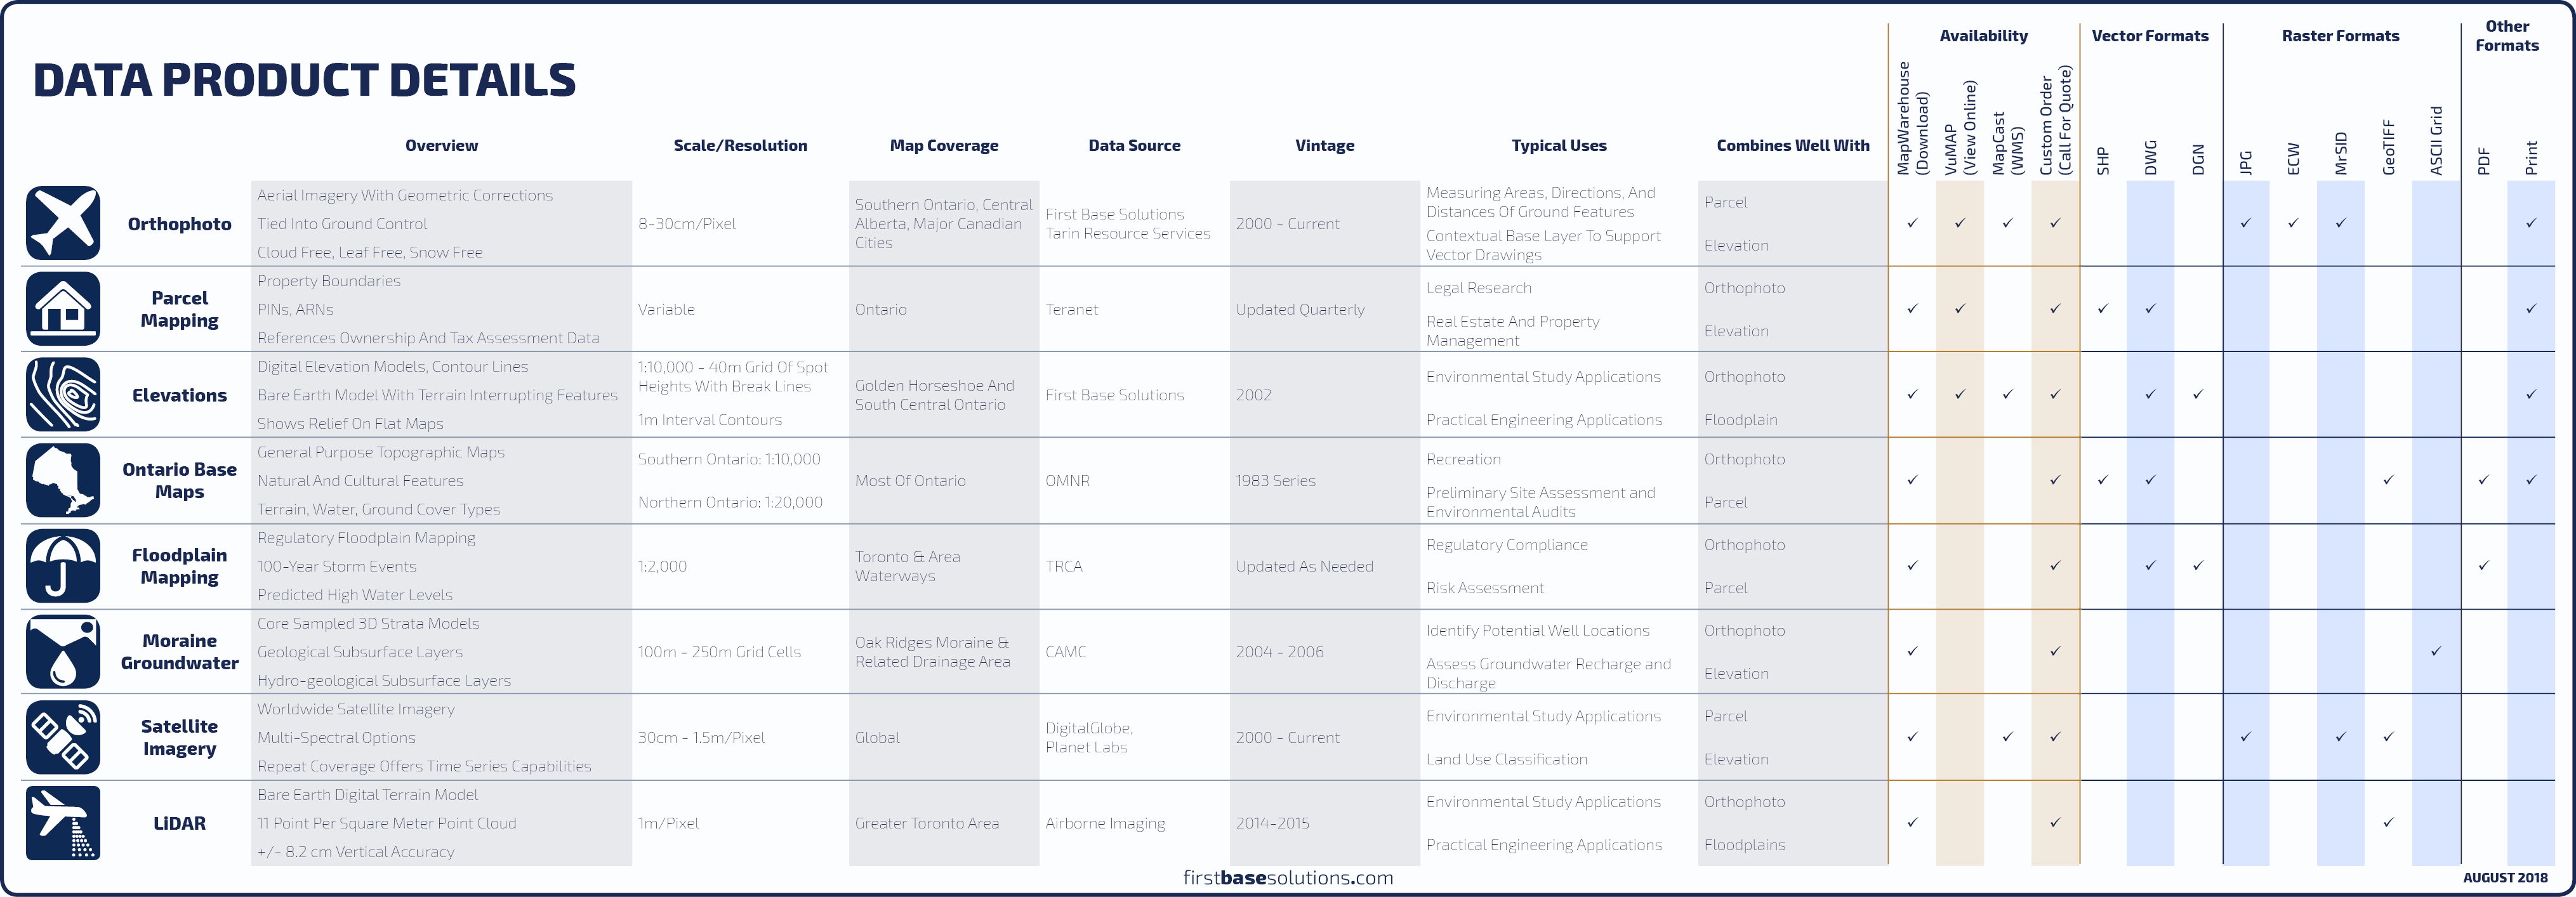
An orthophoto is an aerial photograph geometrically corrected such that the scale and overhead perspective is uniform, enabling users to measure true direction and distance. Compare With Satellite
| FAQs
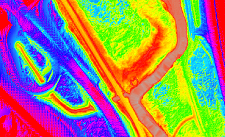
Elevation contours in 1m intervals across the Golden Horseshoe produced by First Base Solutions, and coverage of all Ontario in 5m and 10m intervals. Compare Elevation Mapping
| FAQs
An explanation in plain English without the WTF. Here I’ll recommend which connection type to use and when…
Pricing?
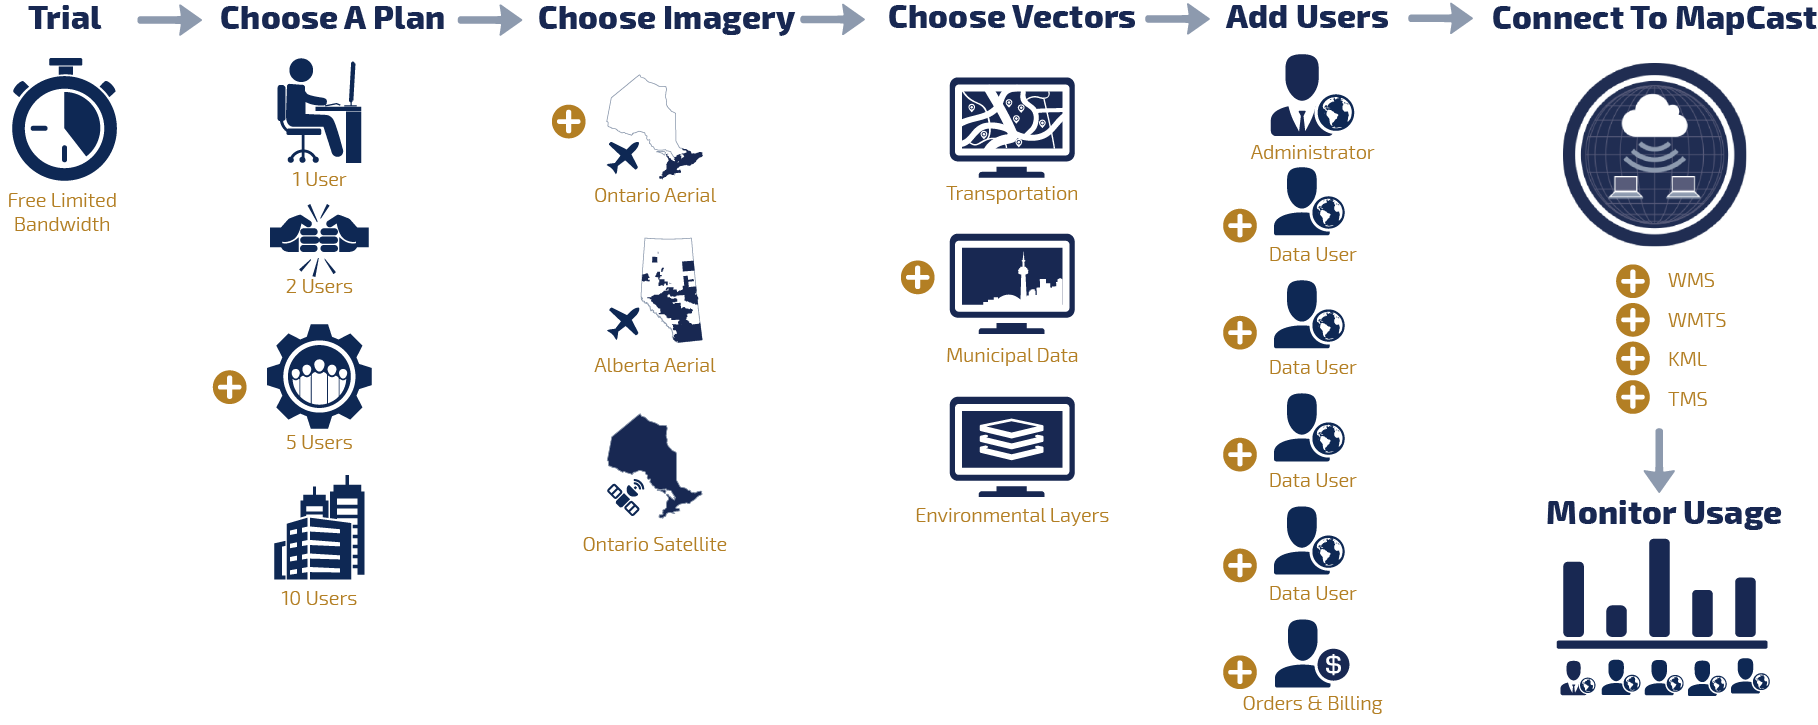
Select an annual plan based on the number of users, then select from aerial and satellite imagery products that match your area of interest. You can also select from free and premium vector overlays to add to your subscription.
Data prices scale with the size of your team, which can be upgraded at any time. Bandwidth overages are billed monthly. Build your subscription now for a personalized quote.
Leverage the rapport you have with your manager combined with the tips below to get your company on MapCast. Here’s how to talk to your boss like a boss…


 905-477-3600
 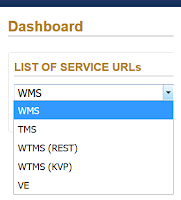 An explanation in plain English without the WTF
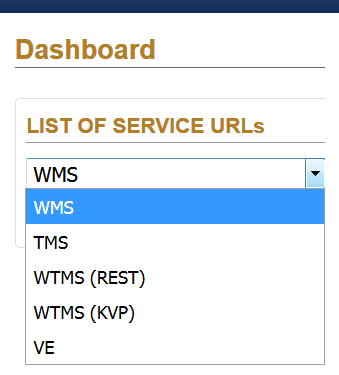

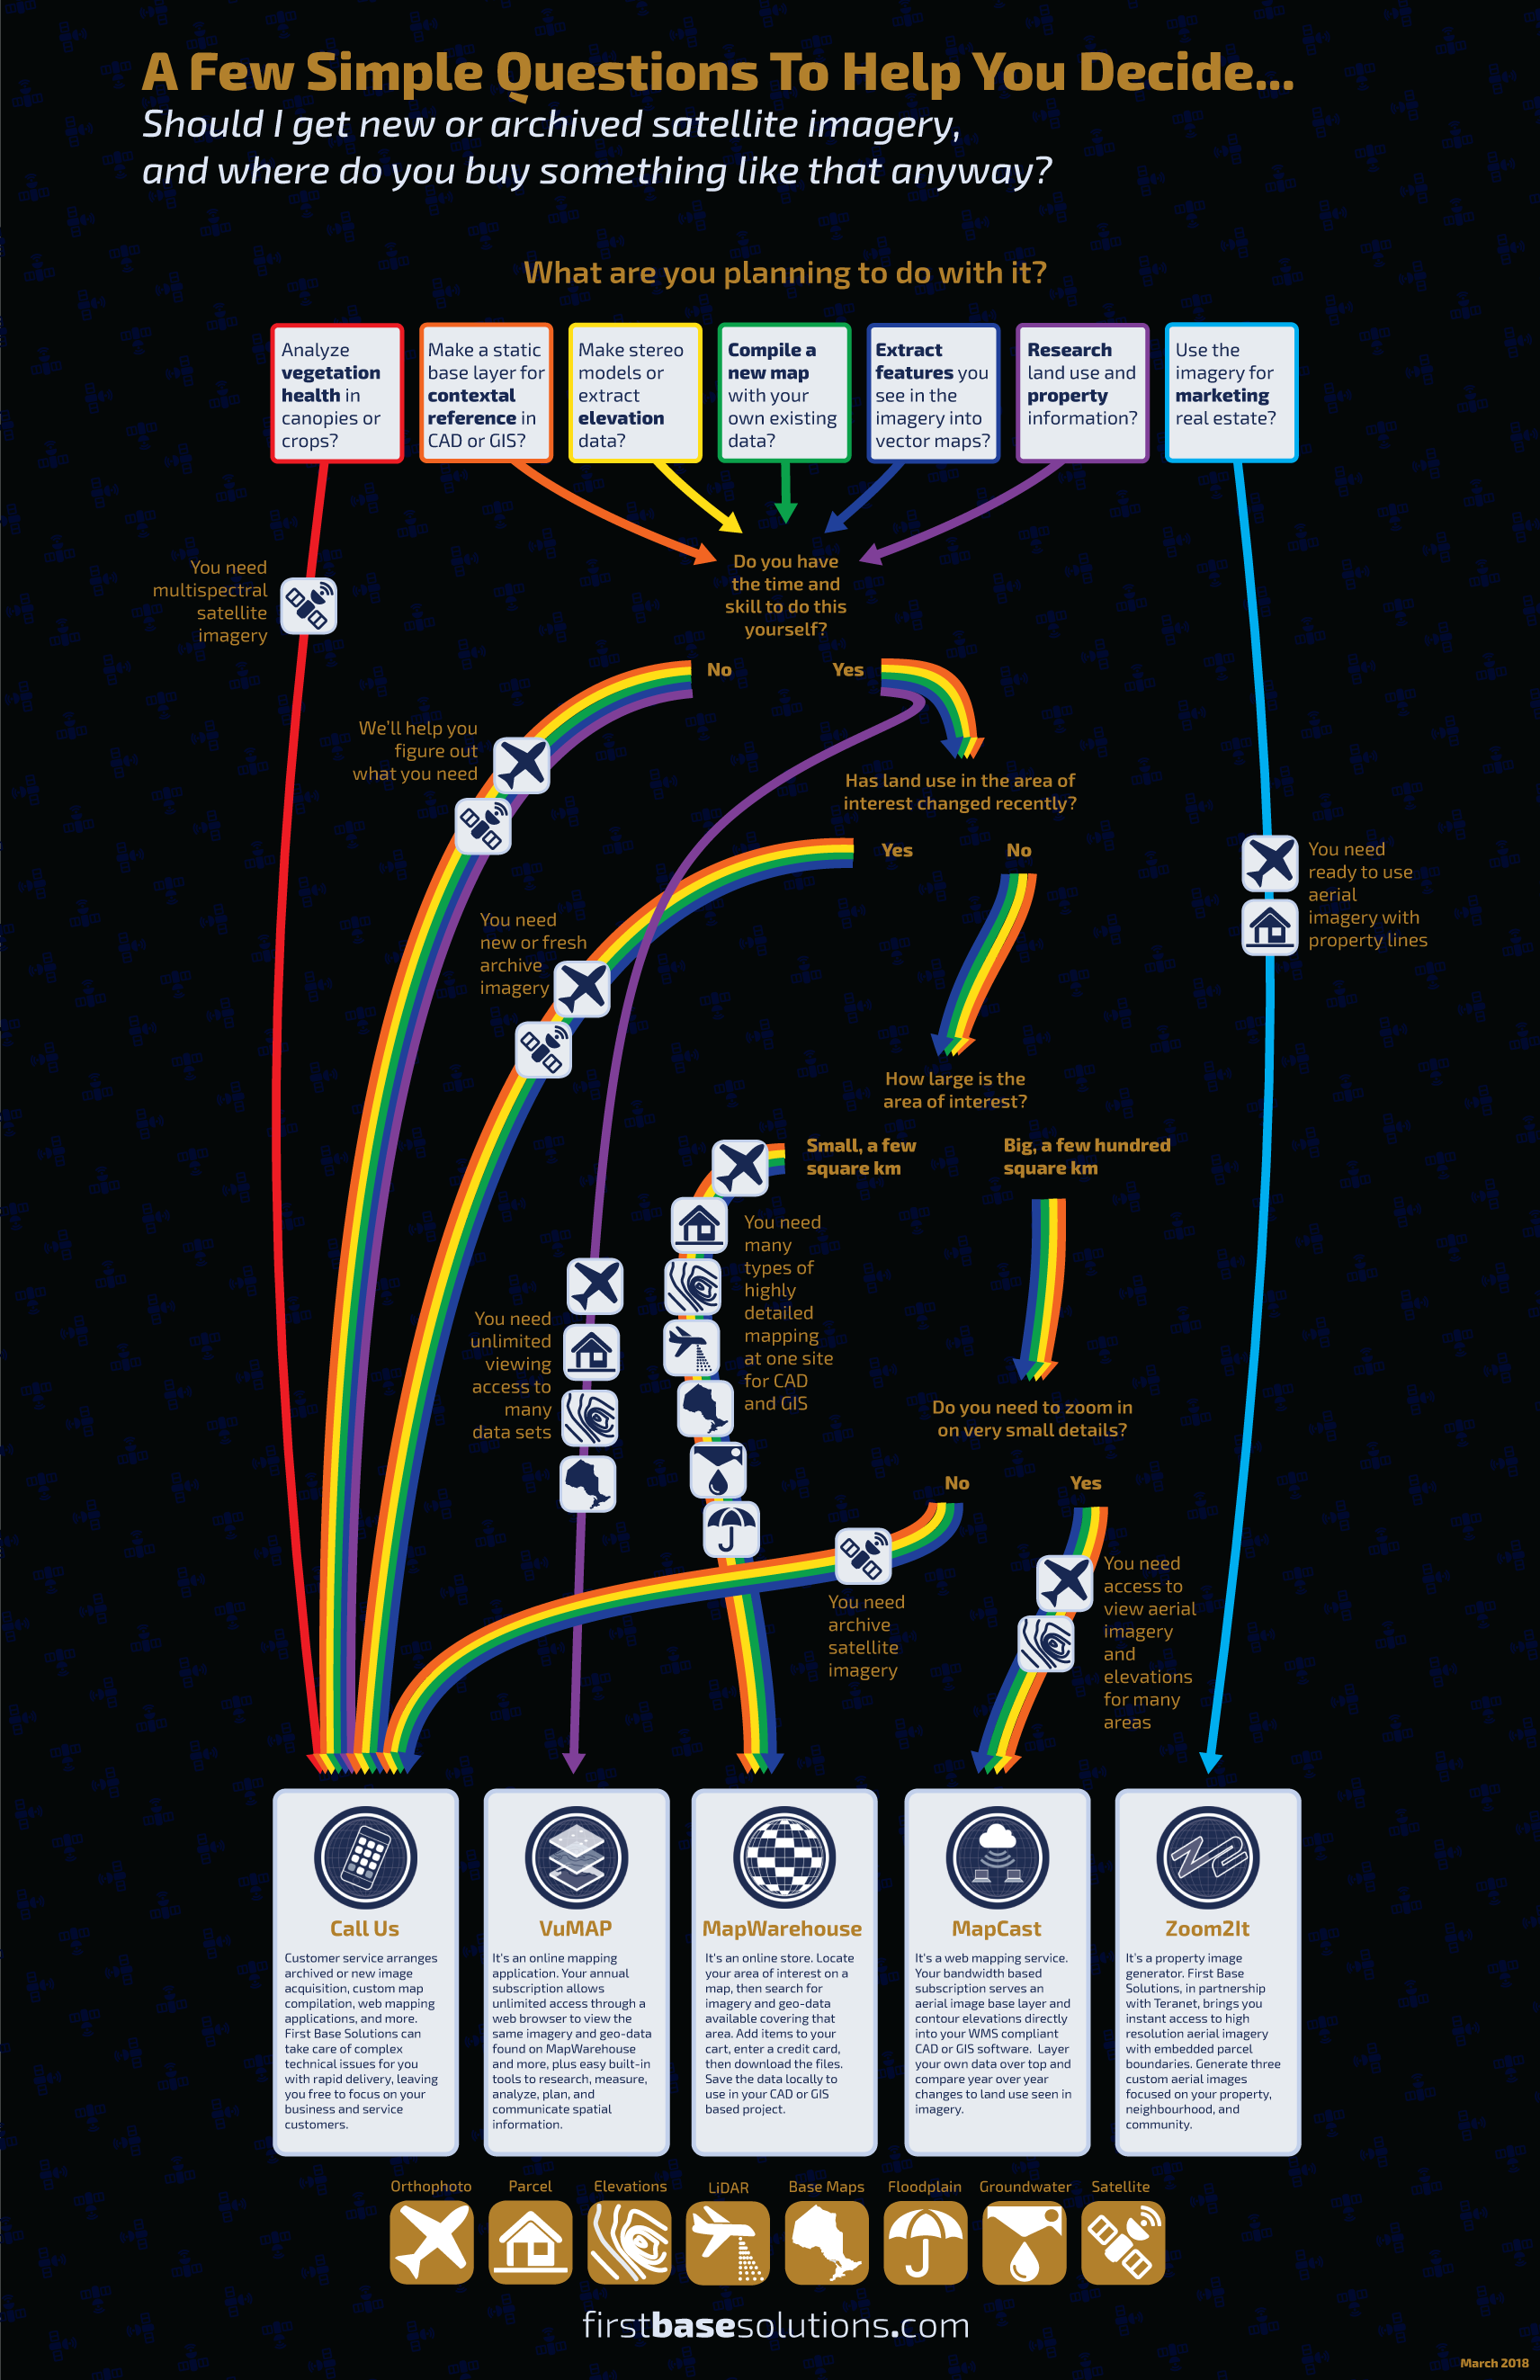
 Blog: Decision Guide: Ground or Aerial Survey?
 MapWarehouse
 MapCast
 VuMAP
VuMAP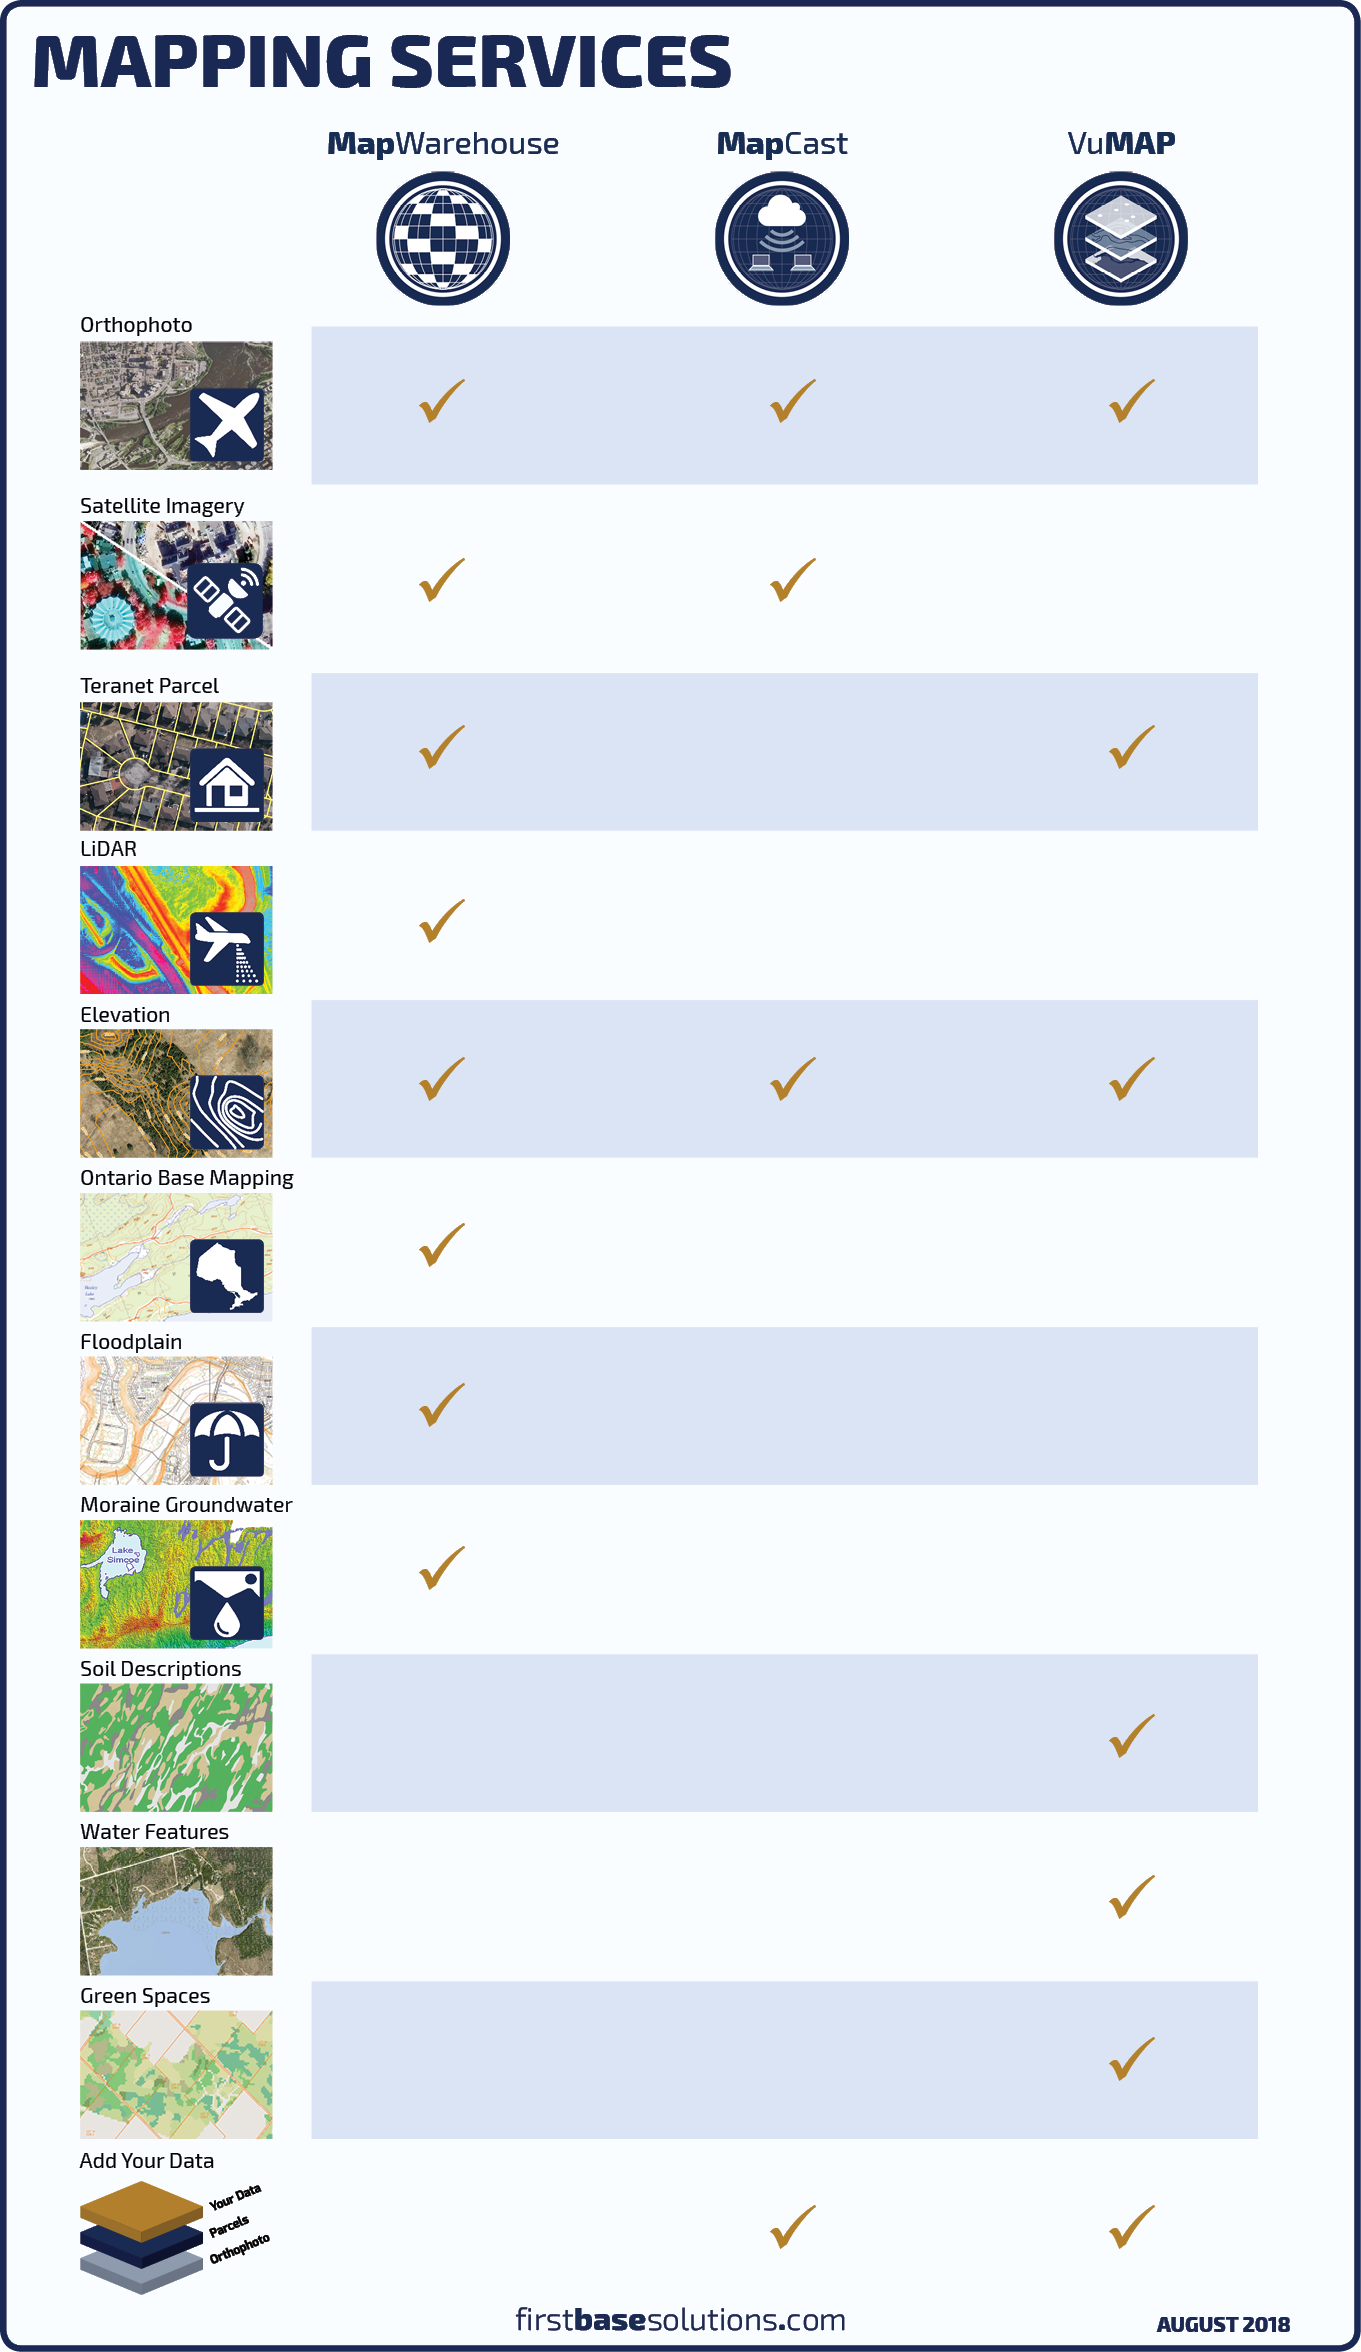


 Compare All Data Products


 Learn More


